Tesla buy opportunity of the year?
Is Tesla the buying opportunity of the year?
Tesla seems to be the hot topic, with bulls being on the extreme side calling for trillion–dollar valuation in a couple of years, yes you read that right, trillions, not billions. While bears are calling for a crash down as they have for the last couple of years, with Morgan Stanley´s recent 10$ worst case prediction. The main factor in their estimate being that demand is drying up. In today’s article, we will build on what we learned from AMZN, to give it a bullish/bearish sentiment, simply based on support and resistance.
Now, before we start I want to emphasize a couple of things. First, even though I am an author here at CVI, and as much as I try to stay neutral and professional, I am still a human. And I truly believe all humans are biased, its in our nature. Number two, I am taking a position in Tesla for myself, and some of my peers have. That position is partly because of the analysis you read, but even more because of the research I have done into Tesla. Remember we at CVI practice what we preach, value investing. In other words, not only do I know the chart in and out, but also the numbers, news, vision, team and so on. And lastly, but most importantly, you should not take this as financial advice. Always do your own research, and remember all investing comes with a risk.
So, let‘s start!
Overview
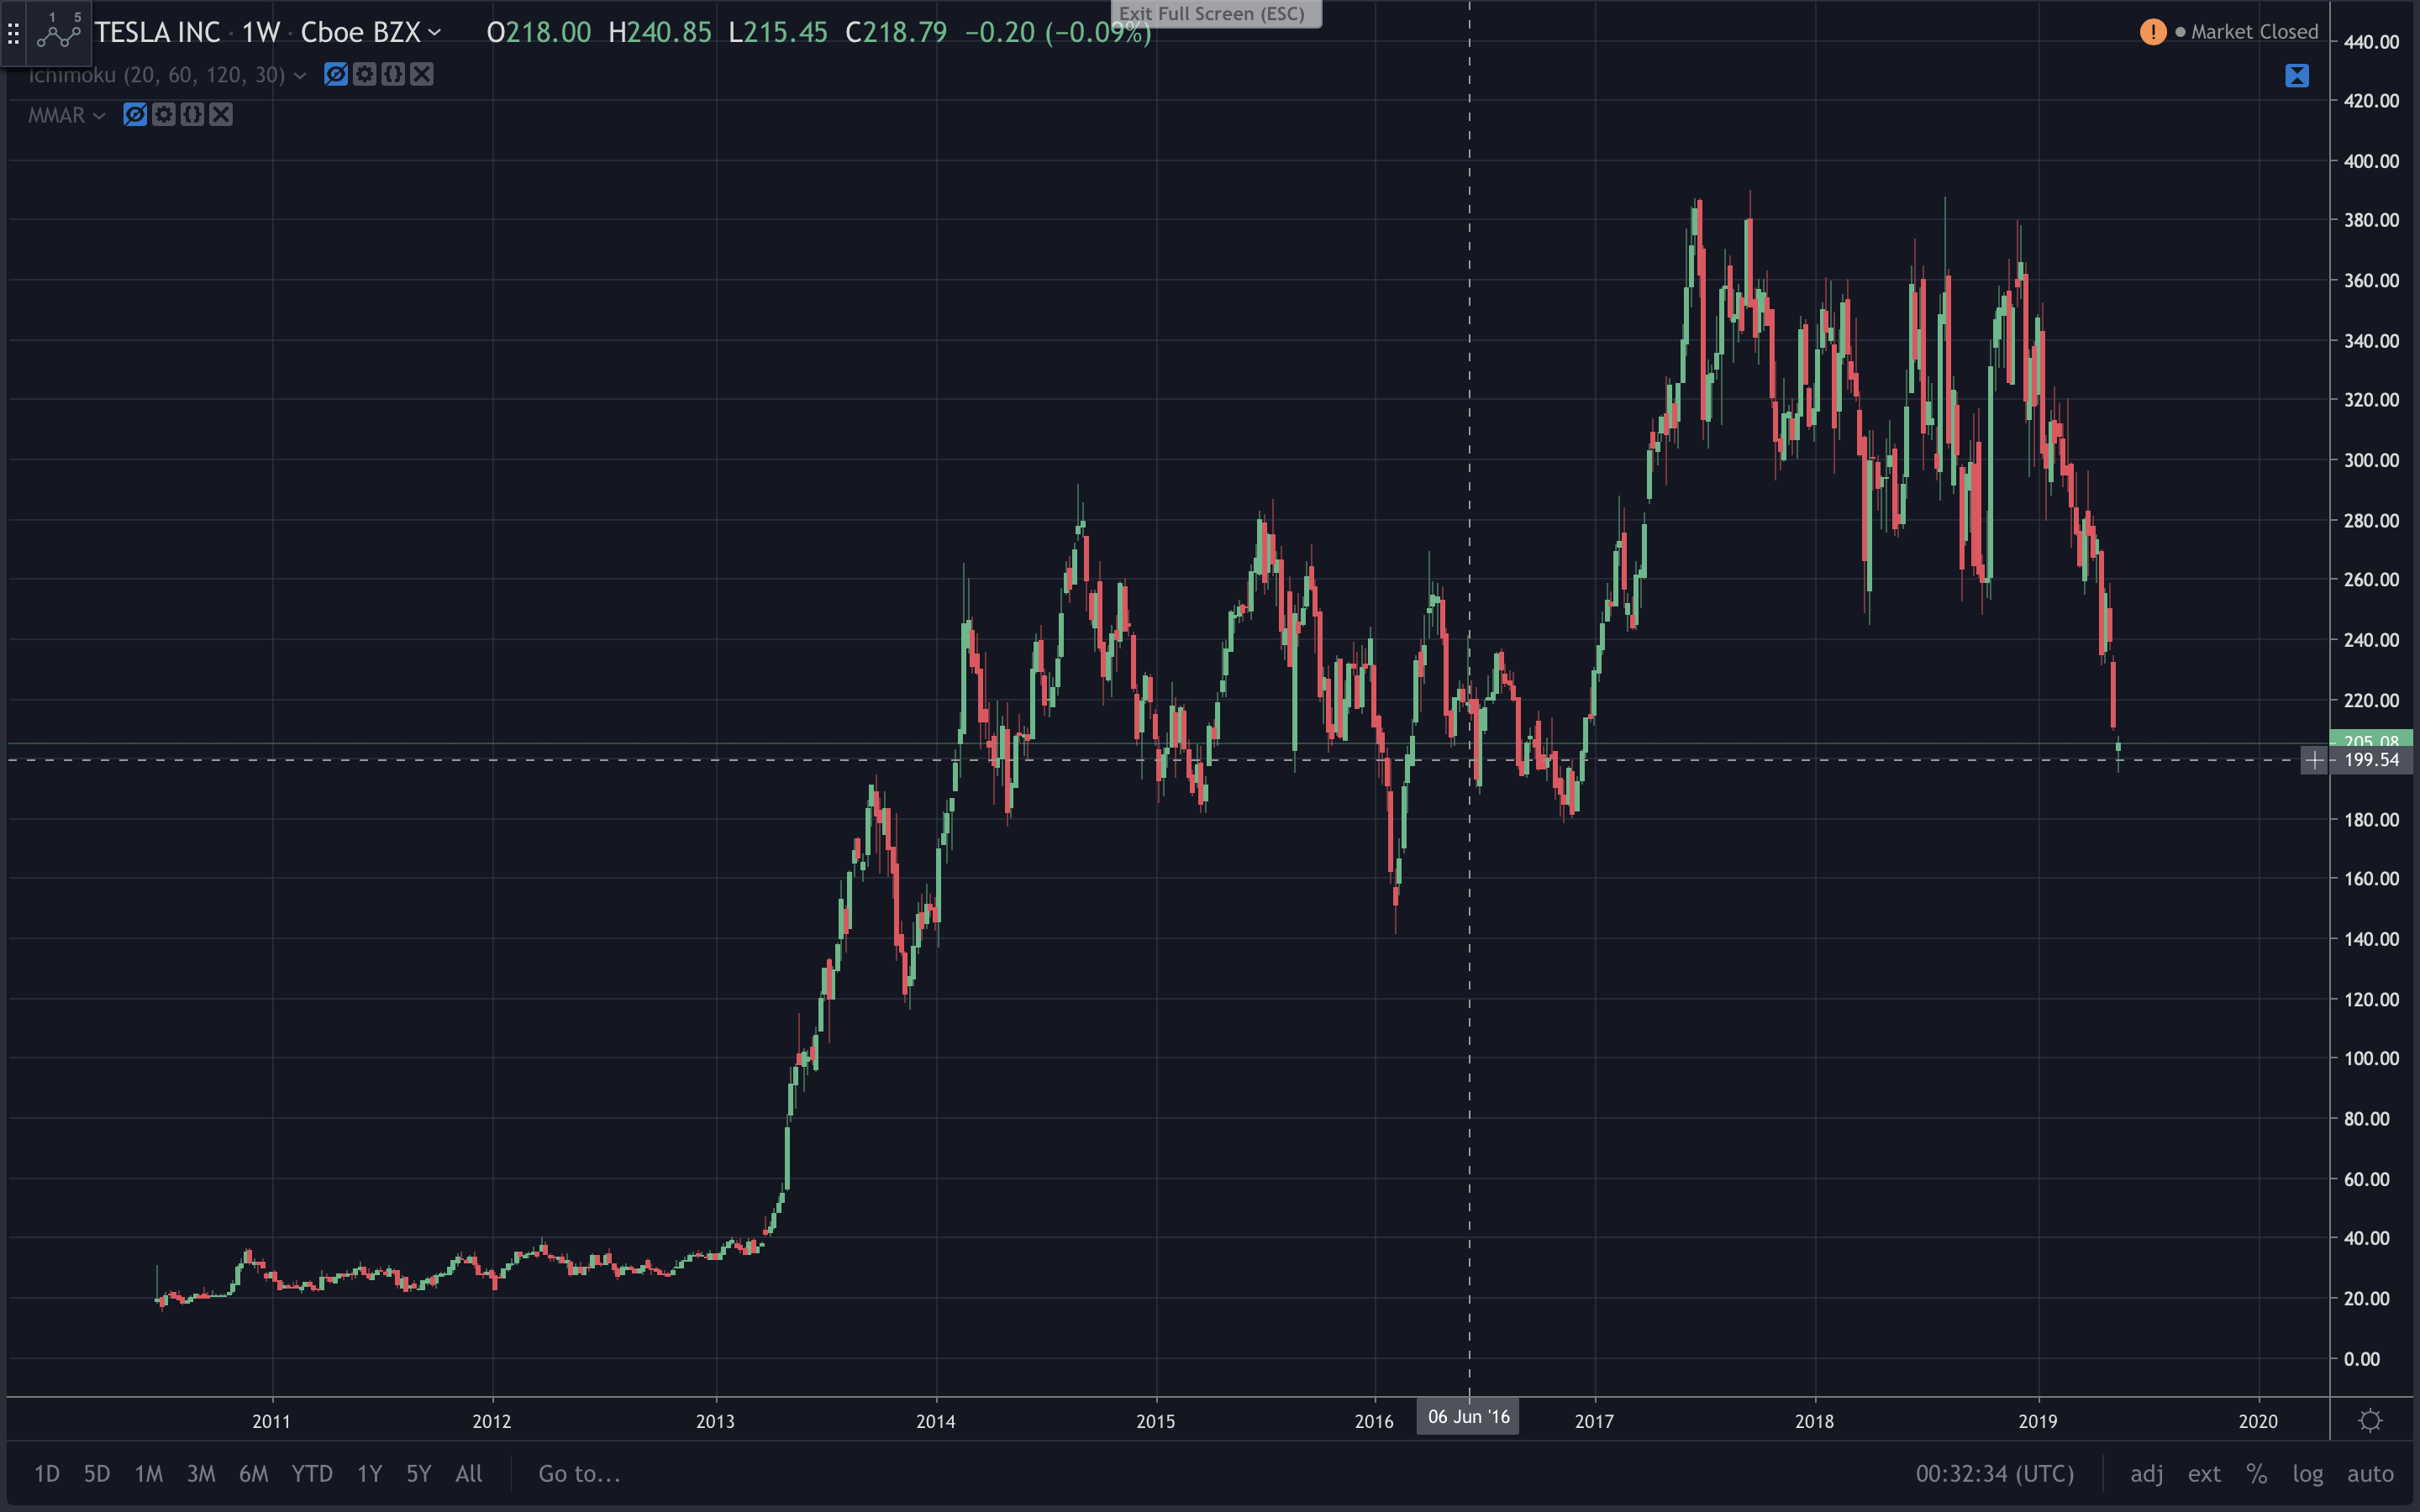
This is the 1W chart if we start at the beginning, we see TSLA being a small company with little price movement over time. In 2013 the first bull rally started with TSLA delivering its first profitable quarterly report.
Part #1 Pretty much not doing anything of significance.
Part #2 Where it had its first bull rally and stagnated up and down for four years between 180-280$. We will talk more about this.
Part #3 That just ended by Tesla breaking out of the main pattern. Notice how part three also had a stagnation period like part two.
Part #4 What now?
Part two
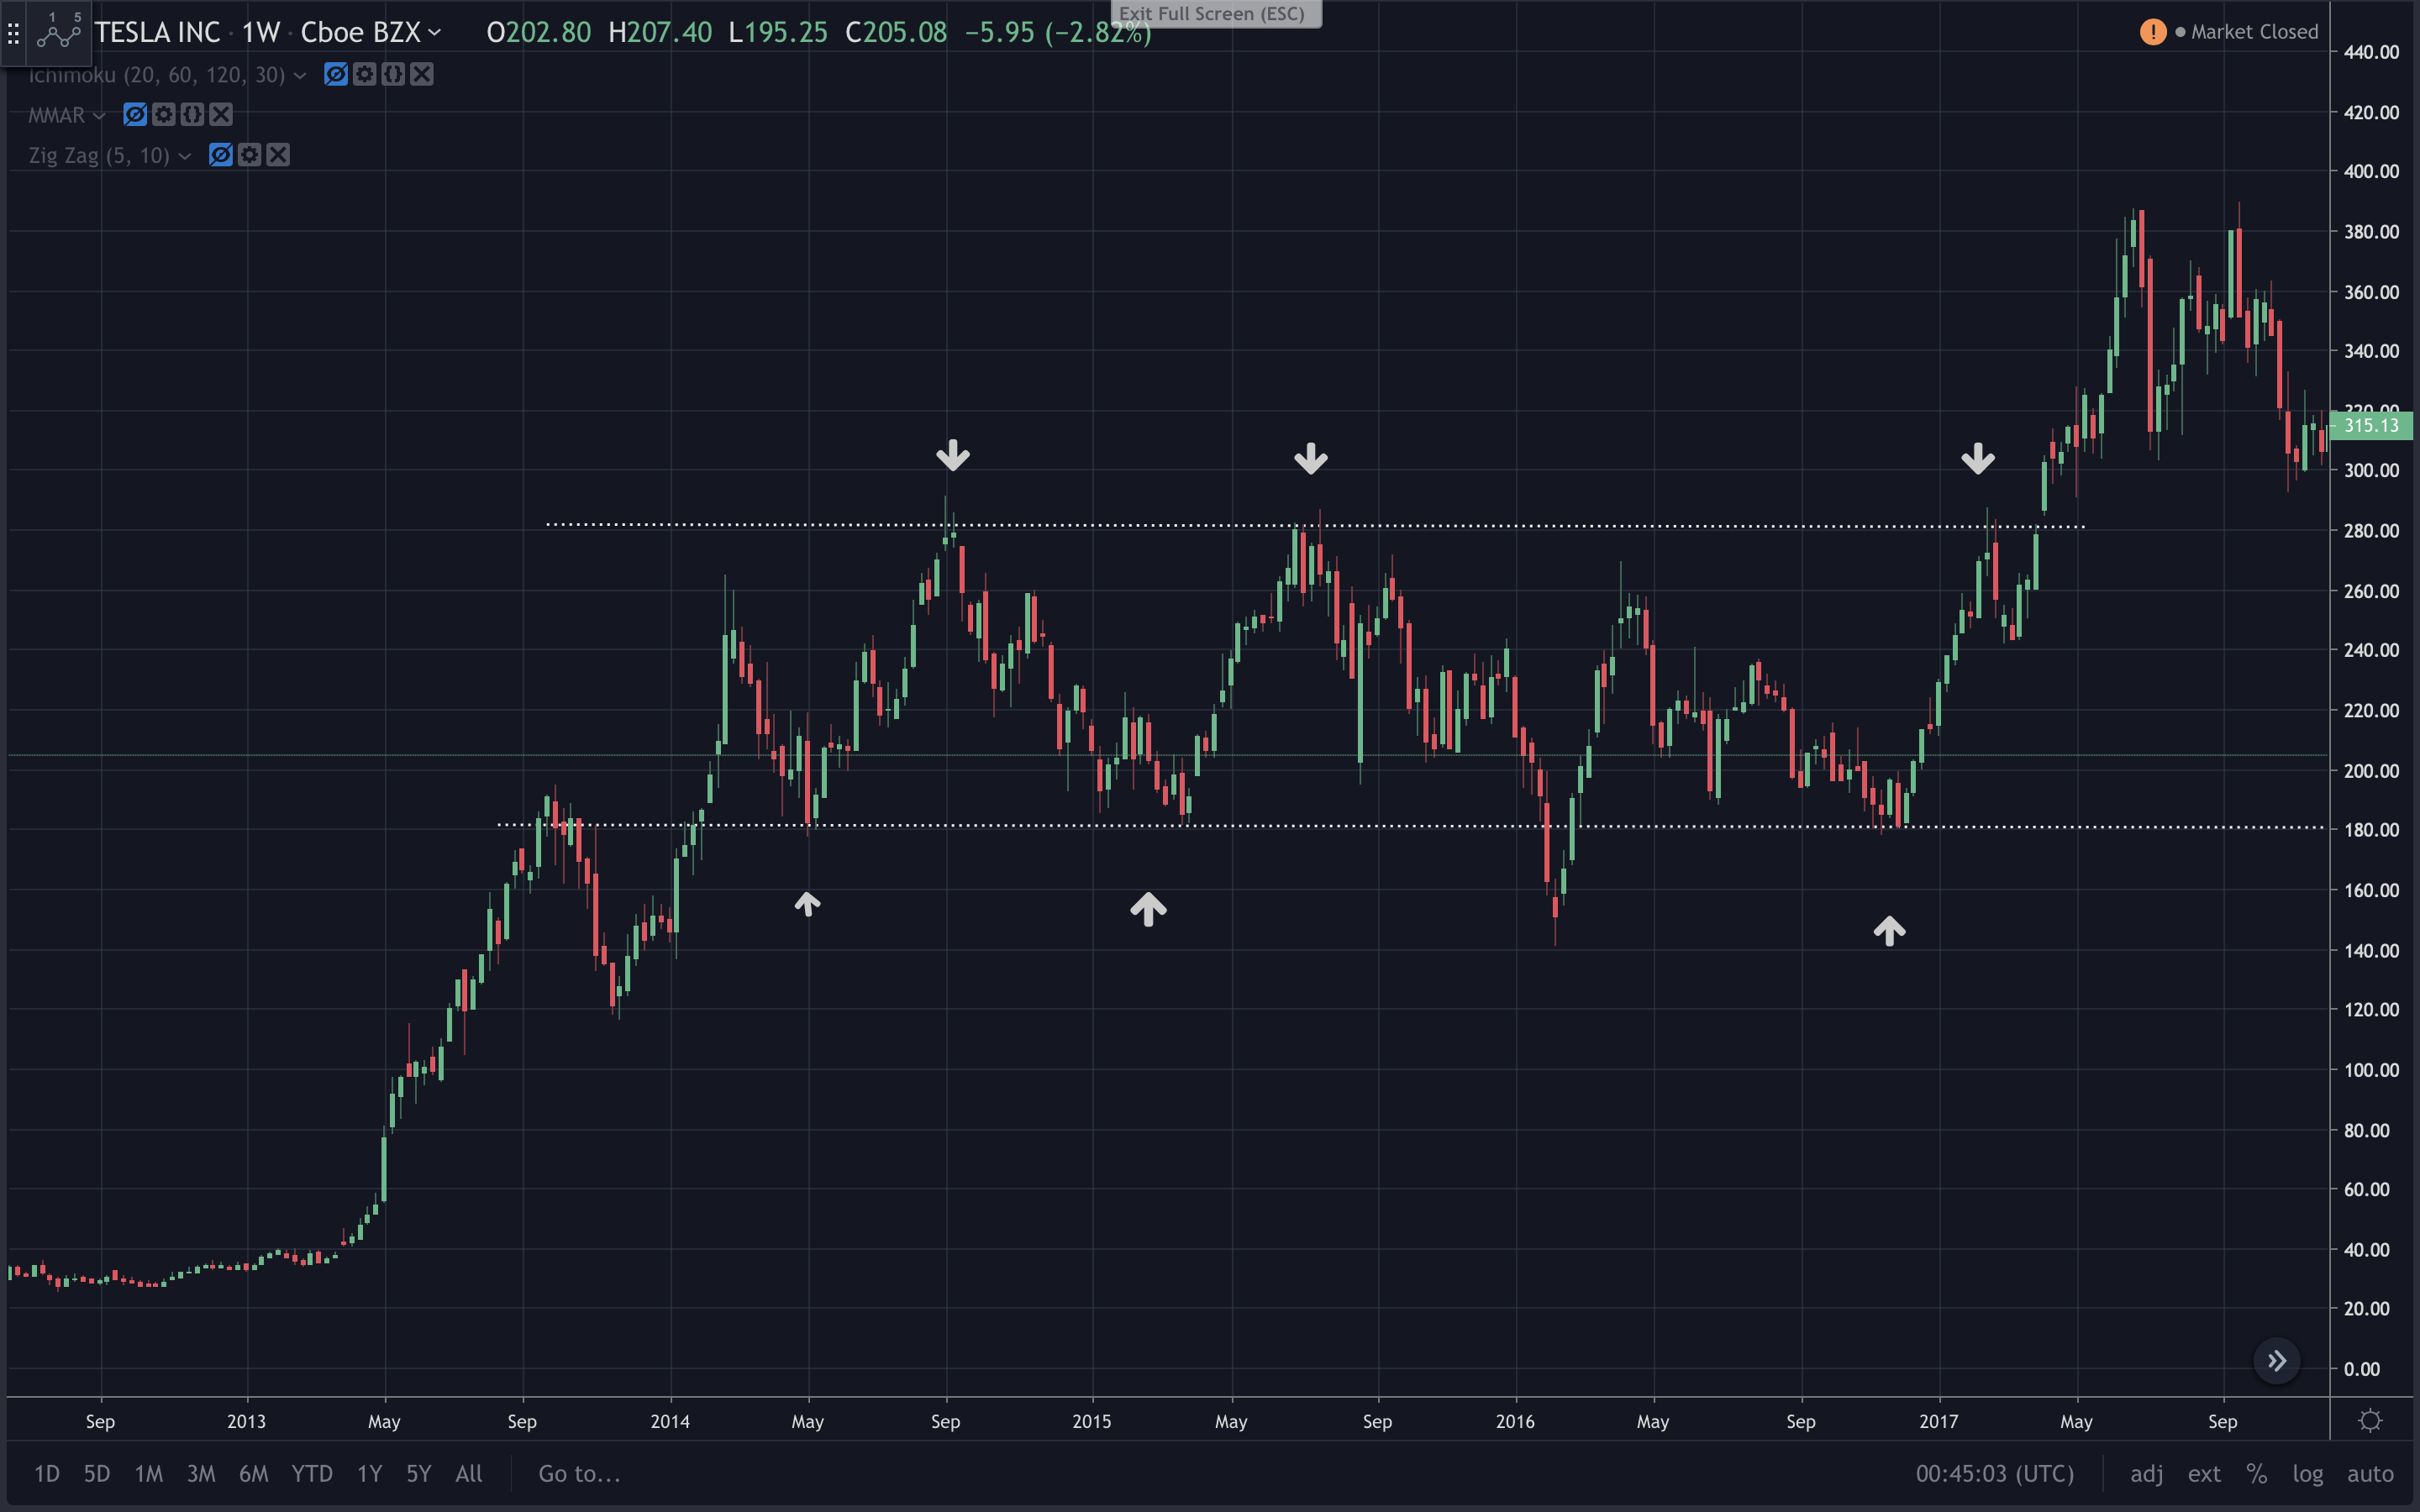
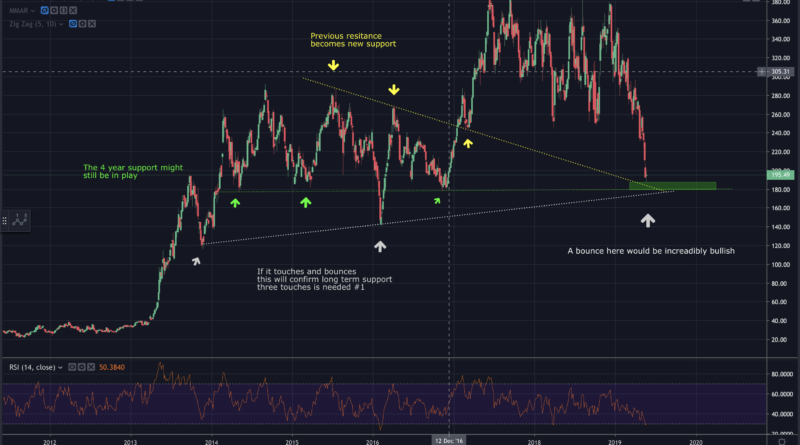
Here you have the 2013 rally to the far left, creating a 4 yearlong channel where the price had a triple top (confirming resistance) at the 290$. With support at 180$. In other words, 180-200$ would be a buy level, whereas 290$ would be a sell mark. With one exception to this rule, in 2014 where the weekly closed under but bounced quickly up.
These are the patterns we want to play. Now, remember, we don´t want to buy a company that is dipping in price. If there has been a negative fundamental change in that company. To elaborate, let´s say news came out that all model S had a problem with their battery, and it would be costly for Tesla. The price would obviously dip, that would not be the buying opportunity we are looking for. We as traders are looking for price dips in a stock that is fundamentally good and there has been little to no fundamental change. Essentially, it’s the market trying to give it a proper valuation based on the information that’s public. More on this later.
Remember the white support line, as it plays a crucial role later.
Part three
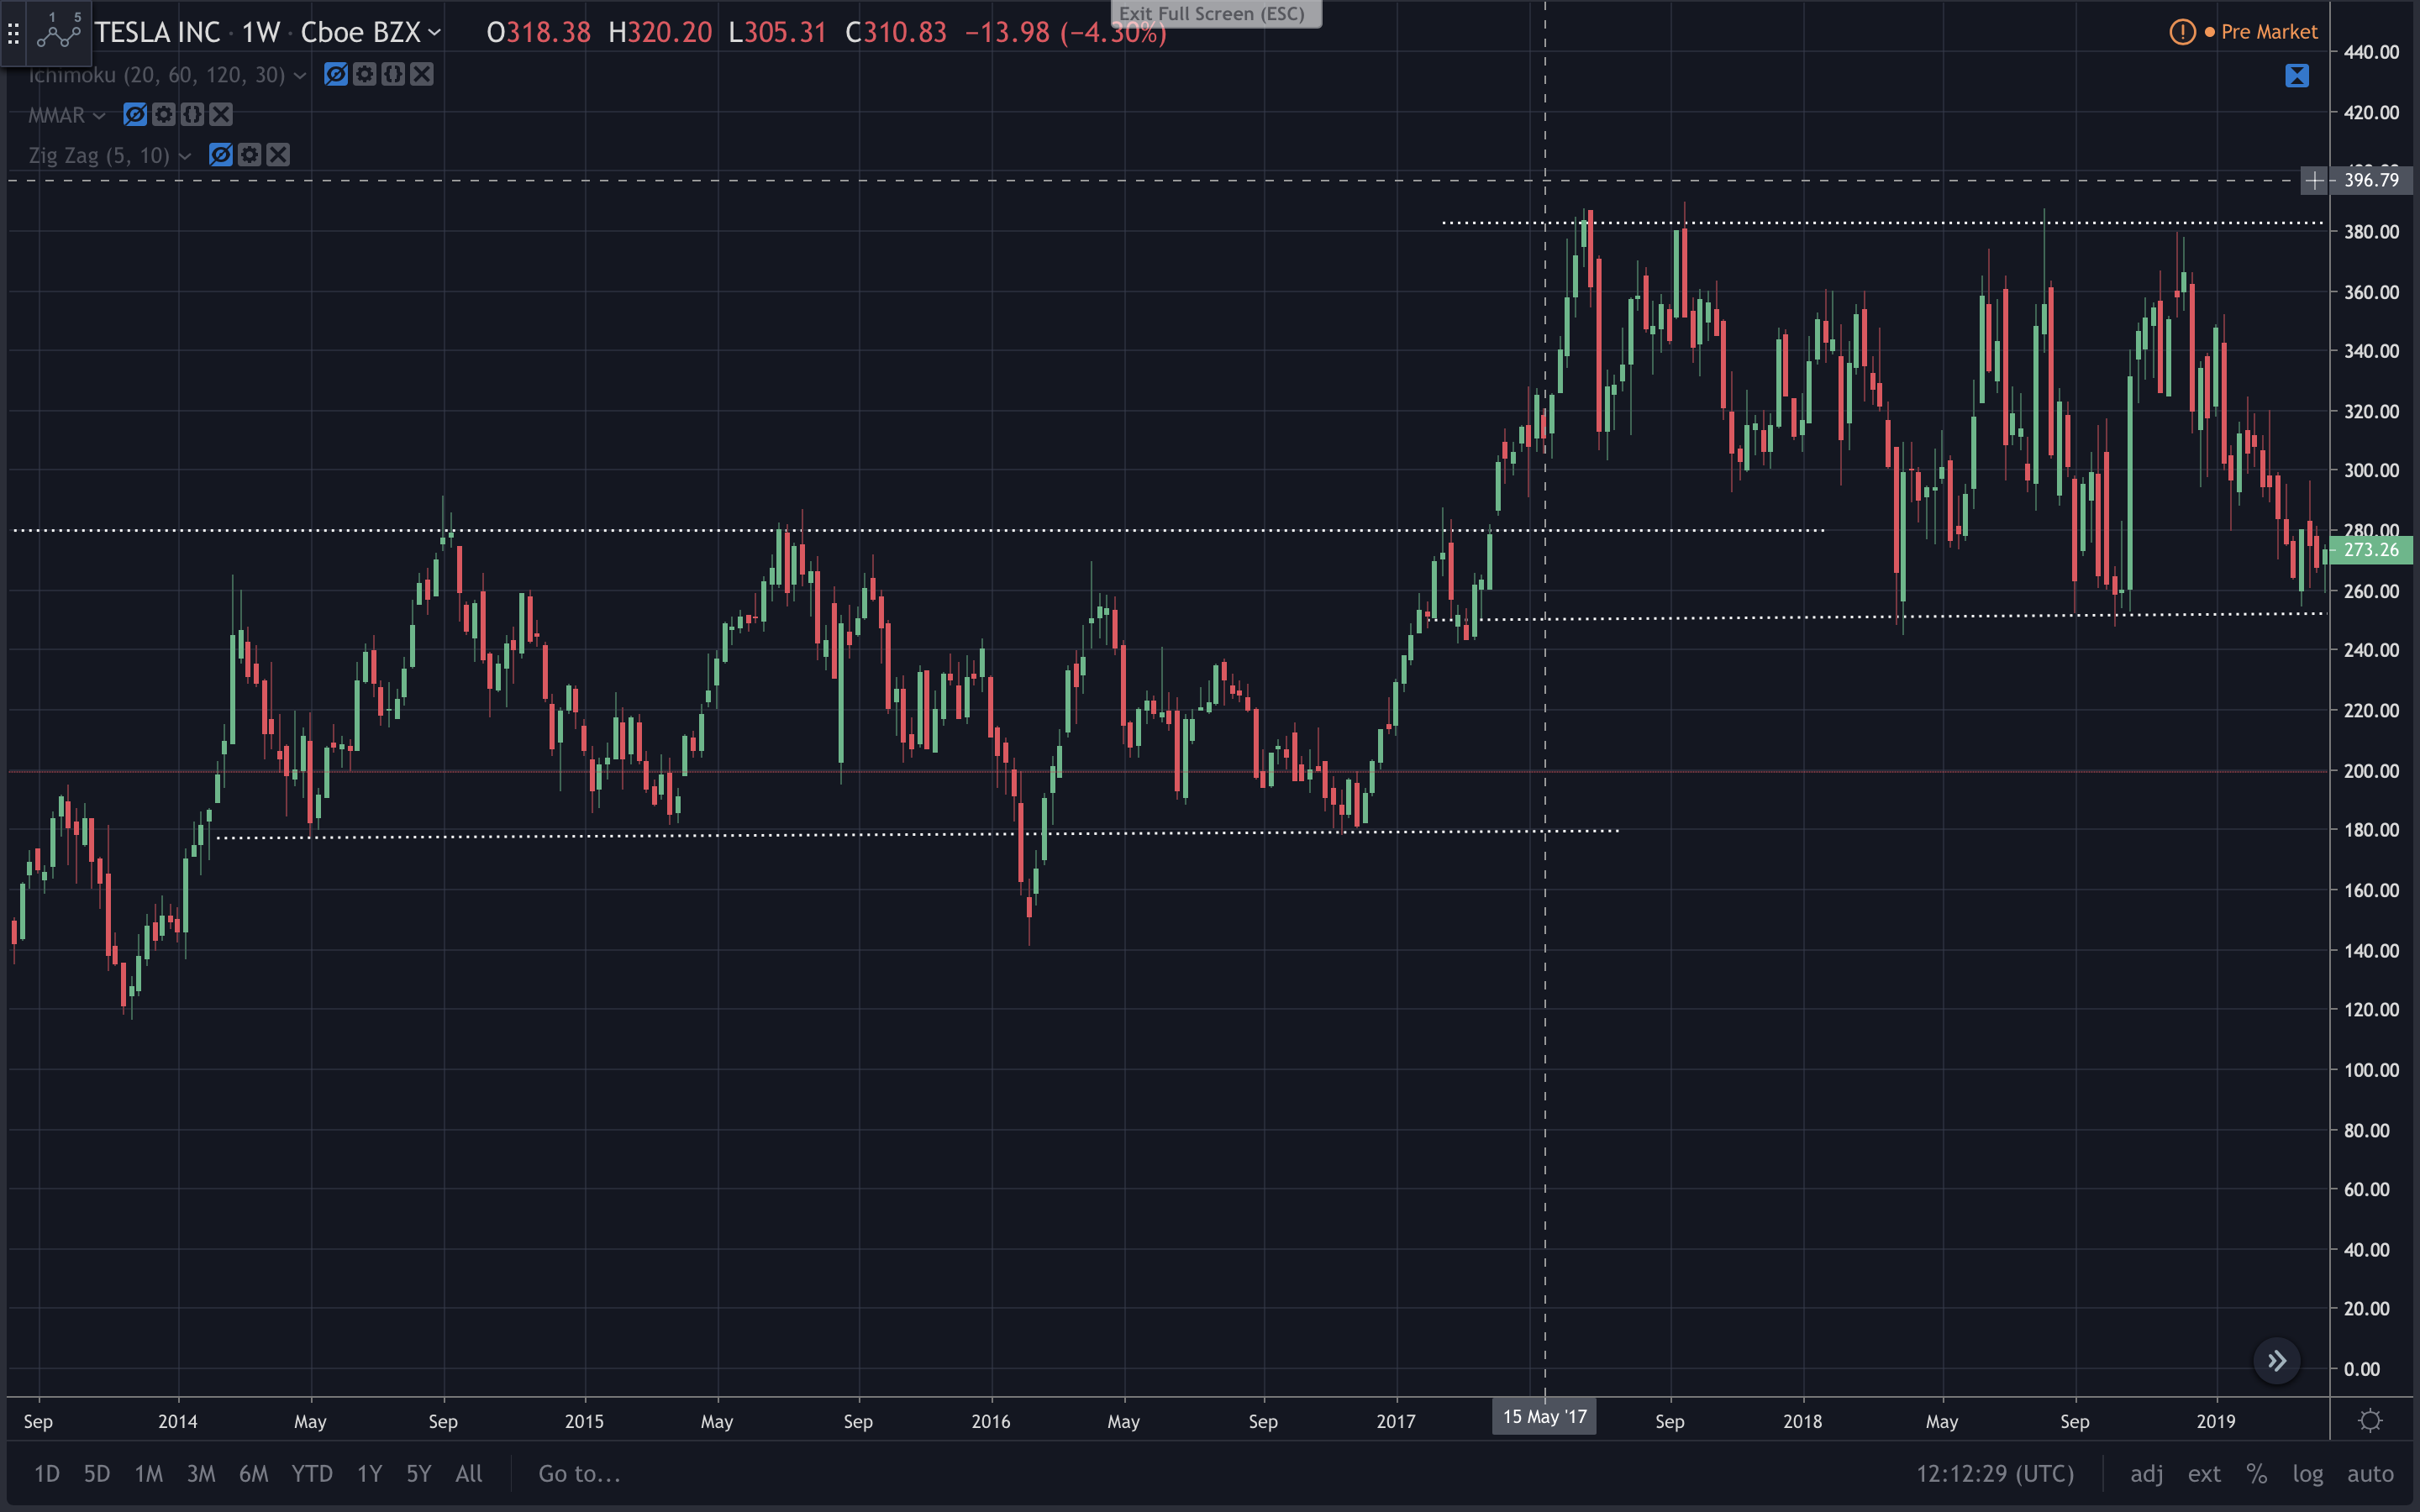
As you can see above, after the price broke out from the 4-year channel, it created a new channel quite similar. With the price moving around 55% within the channel. The new buy level became 250$ and sell at 350$ and upwards. These patterns we can identify thanks to the basic support and resistance lines.
Compared to the previous channel, where it broke up, this one just recently broke down, creating the buying opportunity we are now facing.
All of this can now be used to evaluate Tesla.
Time of writing
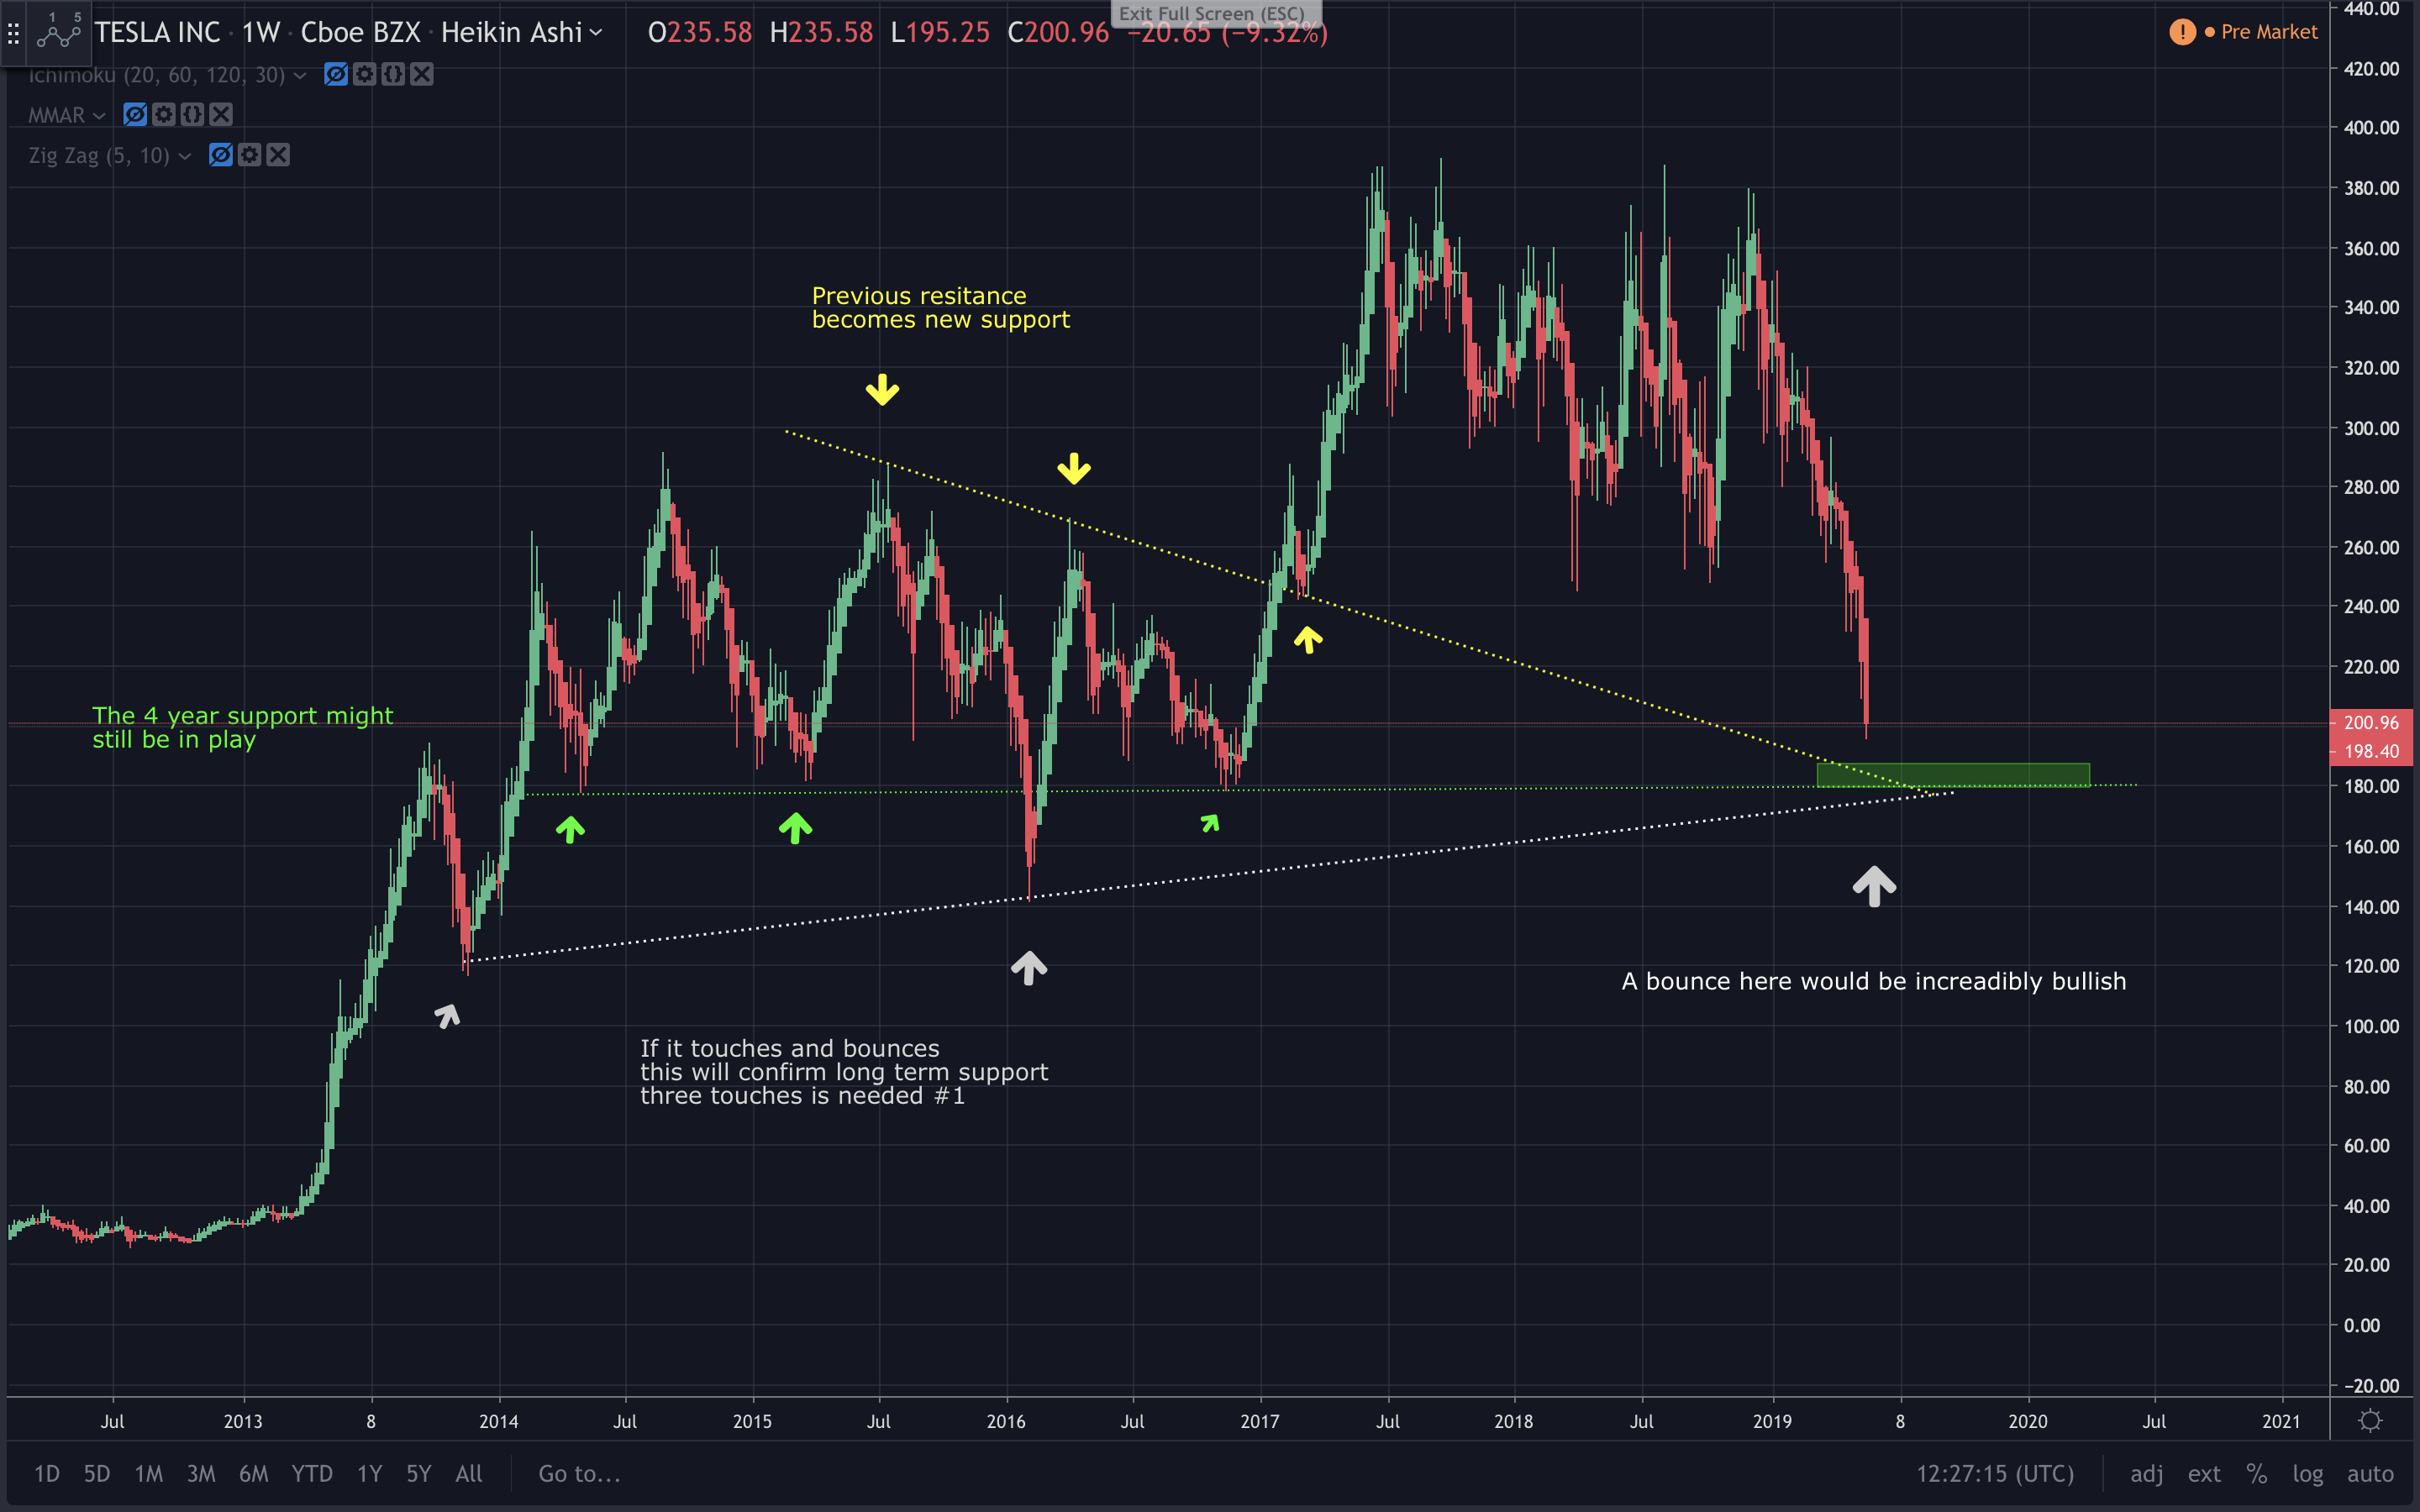
If we look at the first pattern (green), this can possibly be the first time Tesla touches, by itself this would be bullish. In this case, Tesla has at least two other supports. The white one would normally be the long–term bull trend. But in this case, we have only seen two touches, so a third touch (green box) would confirm this bull trend.
Then there is also the yellow line, acting as resistance twice, before the price breaking out, falling back to retest, and then using it as a support. Previous resistance becomes new support. Currently, Tesla has lost half its valuation within 160 days.
What now?
There are several ways to confirm a new bullish trend in a stock price. In Tesla´s case, we want to see a green close for this week. Hopefully a green close next week as well. Other than that, we are looking for special candlestick patterns, like a morningstar. The more volume, the better. Remember there is quite the big possibility of a short squeeze, as investors start noticing the pattern.
For my case, I have a stop-loss at 169$. I would not be comfortable with the price closing under this level, especially considering how strong this support is.
Disclaimer
The content provided in this article belongs to Caribbean Value Investor and all information in this article is not intended and does not constitute as legal or investment advice. Please do your own research.