Using the Moving Average to increase returns
In today’s article, we will explain how to implement a simple Moving Average strategy to increase return and minimize risk. We use Apple as an example whereby implementing this strategy almost doubled the return. This is part one of our Moving Average series.
Most traders use a whole range of technical indicators when charting. In essence, technical indicators are mathematical calculations based on price and volume. Traders essentially use old price history to predict future price movement. The beautiful thing about indicators is they give a lot in information simply by glazing over them for a couple of seconds.
MA (moving averages)
The Moving Average (MA) is one of the most popular indicators within technical analysis. It works by taking the last X days price action to make an average, and this results in one smooth line reflecting the price. One can use different values, for instance, 21, 50, 100 and 200 are quite popular. A 50 MA would take the last 50 days of price data, calculate it to create a moving average.
Sponsored
All Moving Averages are lagging indicators, as its always based on previous price data. This is why more significant values like 100 and 200 will lag more, as they have more data calculated in, and new data weigh less compared to some indicators where new data is calculated almost immediately, like the RSI.
How to trade using one Moving Average (200MA)
We will be using Apple as an example. The reason being is to clearly show how technical analysis is not only for traders but also for investors. If implemented right, one can increase returns exponentially, but more importantly, minimizing risk. Technical Analysis gives investors the opportunity to sell a position before a retrace, inherently increasing shares when buying back. Like in the example shown below. More on this another time.
Now if you had bought shares of Apple when the MA first gave a buy signal, you would have a total gain of 230-240% (at time of writing, ATH is 230$). But if you had implemented the simple strategy I am about to give, you would have a return of more then 500% in the same period. Remember we at CVI practice what we preach, value investing.
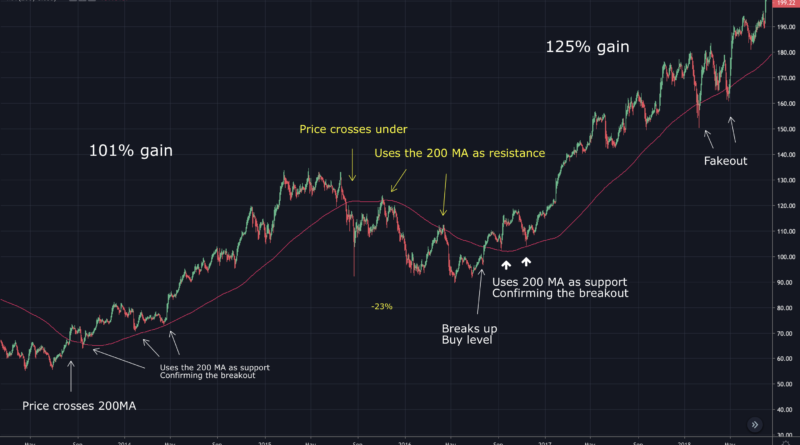
Before looking at the chart you will need some basic information. The pink line is the 200MA. Each time the price crosses over signals a trend reversal. In other words, if the trading price is above the MA, and crosses under, that would be a sell/short signal. Vice versa if it crosses upwards. That being said, not every cross is valid. In some cases a price will crossover then quickly bounce back, creating what is referred to as a “fake out.”
Advertisement
Confirming the trend
Therefore we also need to validate the crossovers. We do this by paying close attention to the price after it crosses. The most prominent signal to confirm a crossover is when the price retests the MA. This is marked in the chart with arrows and text. Each time the price crosses, it ends up hitting the MA but gets rejected, confirming trend reversal. Each cross is parted in with text below. You will have to read each paragraph carefully while studying the chart for the best understanding.

First Crossover
I want you to look to the far left. Look how the price crosses over the MA, marked with a white arrow. This would be our buy signal. The new bullish trend is confirmed shortly after when the price retest the MA and uses it as support.
If you had bought for 1000 dollars at the breakout and held until the price crossed negatively, you would have a maximum gain of 101% or 86% at the sell signal.
Second cross
Ads by Google
Now if you look in the middle of the chart, the price crosses downwards, this is our sell/short signal (marked with yellow arrow). If you sold your position here and went short, you would have a maximum of 23% gain, giving you a total of 2230$. Look how similar the first crossover and the second one is. Both end up using the MA as support/resistance later, confirming the new trend.
Last crossover
The same story goes for the last crossover (marked with green box). It crosses upwards, dropping down in price and now using the MA as support, twice. Just like the first crossover fell back down and used the 200MA as support, confirming the new bull trend. Go long here with the 2230$ would give a maximum return of 125%. Leaving you with a total of 5017$. Compared to the 2230$ if you had gone long from the start and not used the 200MA to your advantage.
The same strategy shown can be applied to lower time frames as well as 1H or even 30M. Next time we will go over the famous “death cross” and “golden cross.”
Follow us on social media: @cvijamaica


Pingback:Why I sold all my Tesla shares | Caribbean Value Investor - Articles and Analysis