A brief history of AMZN and how to trade it
Today we´ll talk about my first significant investment in the stock market, Amazon. Not only is it my first, but it´s one of the stocks I have traded the best. In return, it generated me the most profit, thanks to some good timed sells/buys.
DOTCOM bubble
The first chart you see is from the dotcom bubble. AMZN had some quite volatile days. Going up 170% in 70 days, followed by +50% drops, followed by new gains again. All cycles. Pay attention to the double top it formed at 110$. This trend line is more commonly known as resistance.

The double top resistance stod unchallenged for 10 years, finally it got broken. I show you this to put in perspective how massive bubbles are. It took AMZN ten years of growth to hit the same valuation as previously. The incredibly high valuation AMZN had in 1999 was all based on hype. Big ideas tend to create bug bubbles. Which is why I vary of stocks like BYND, it´s a big idea with an even bigger valuation. Same goes for cryptocurrencies. This does not mean I don´t trade them, as they can be very profitable.

2016-2017
The next picture I will show is between 2016 and late 2017. AMZN formed what is knows as a bullish channel. Where it bounces on support, but gets rejected at resistance. Identifing these channels can be very profitable, as one can increase shares substantially by participating in low-risk trades. We identify different trend lines but using our golden rules, three touches. Both the resistance and support have more than three touches confirming the trend line.
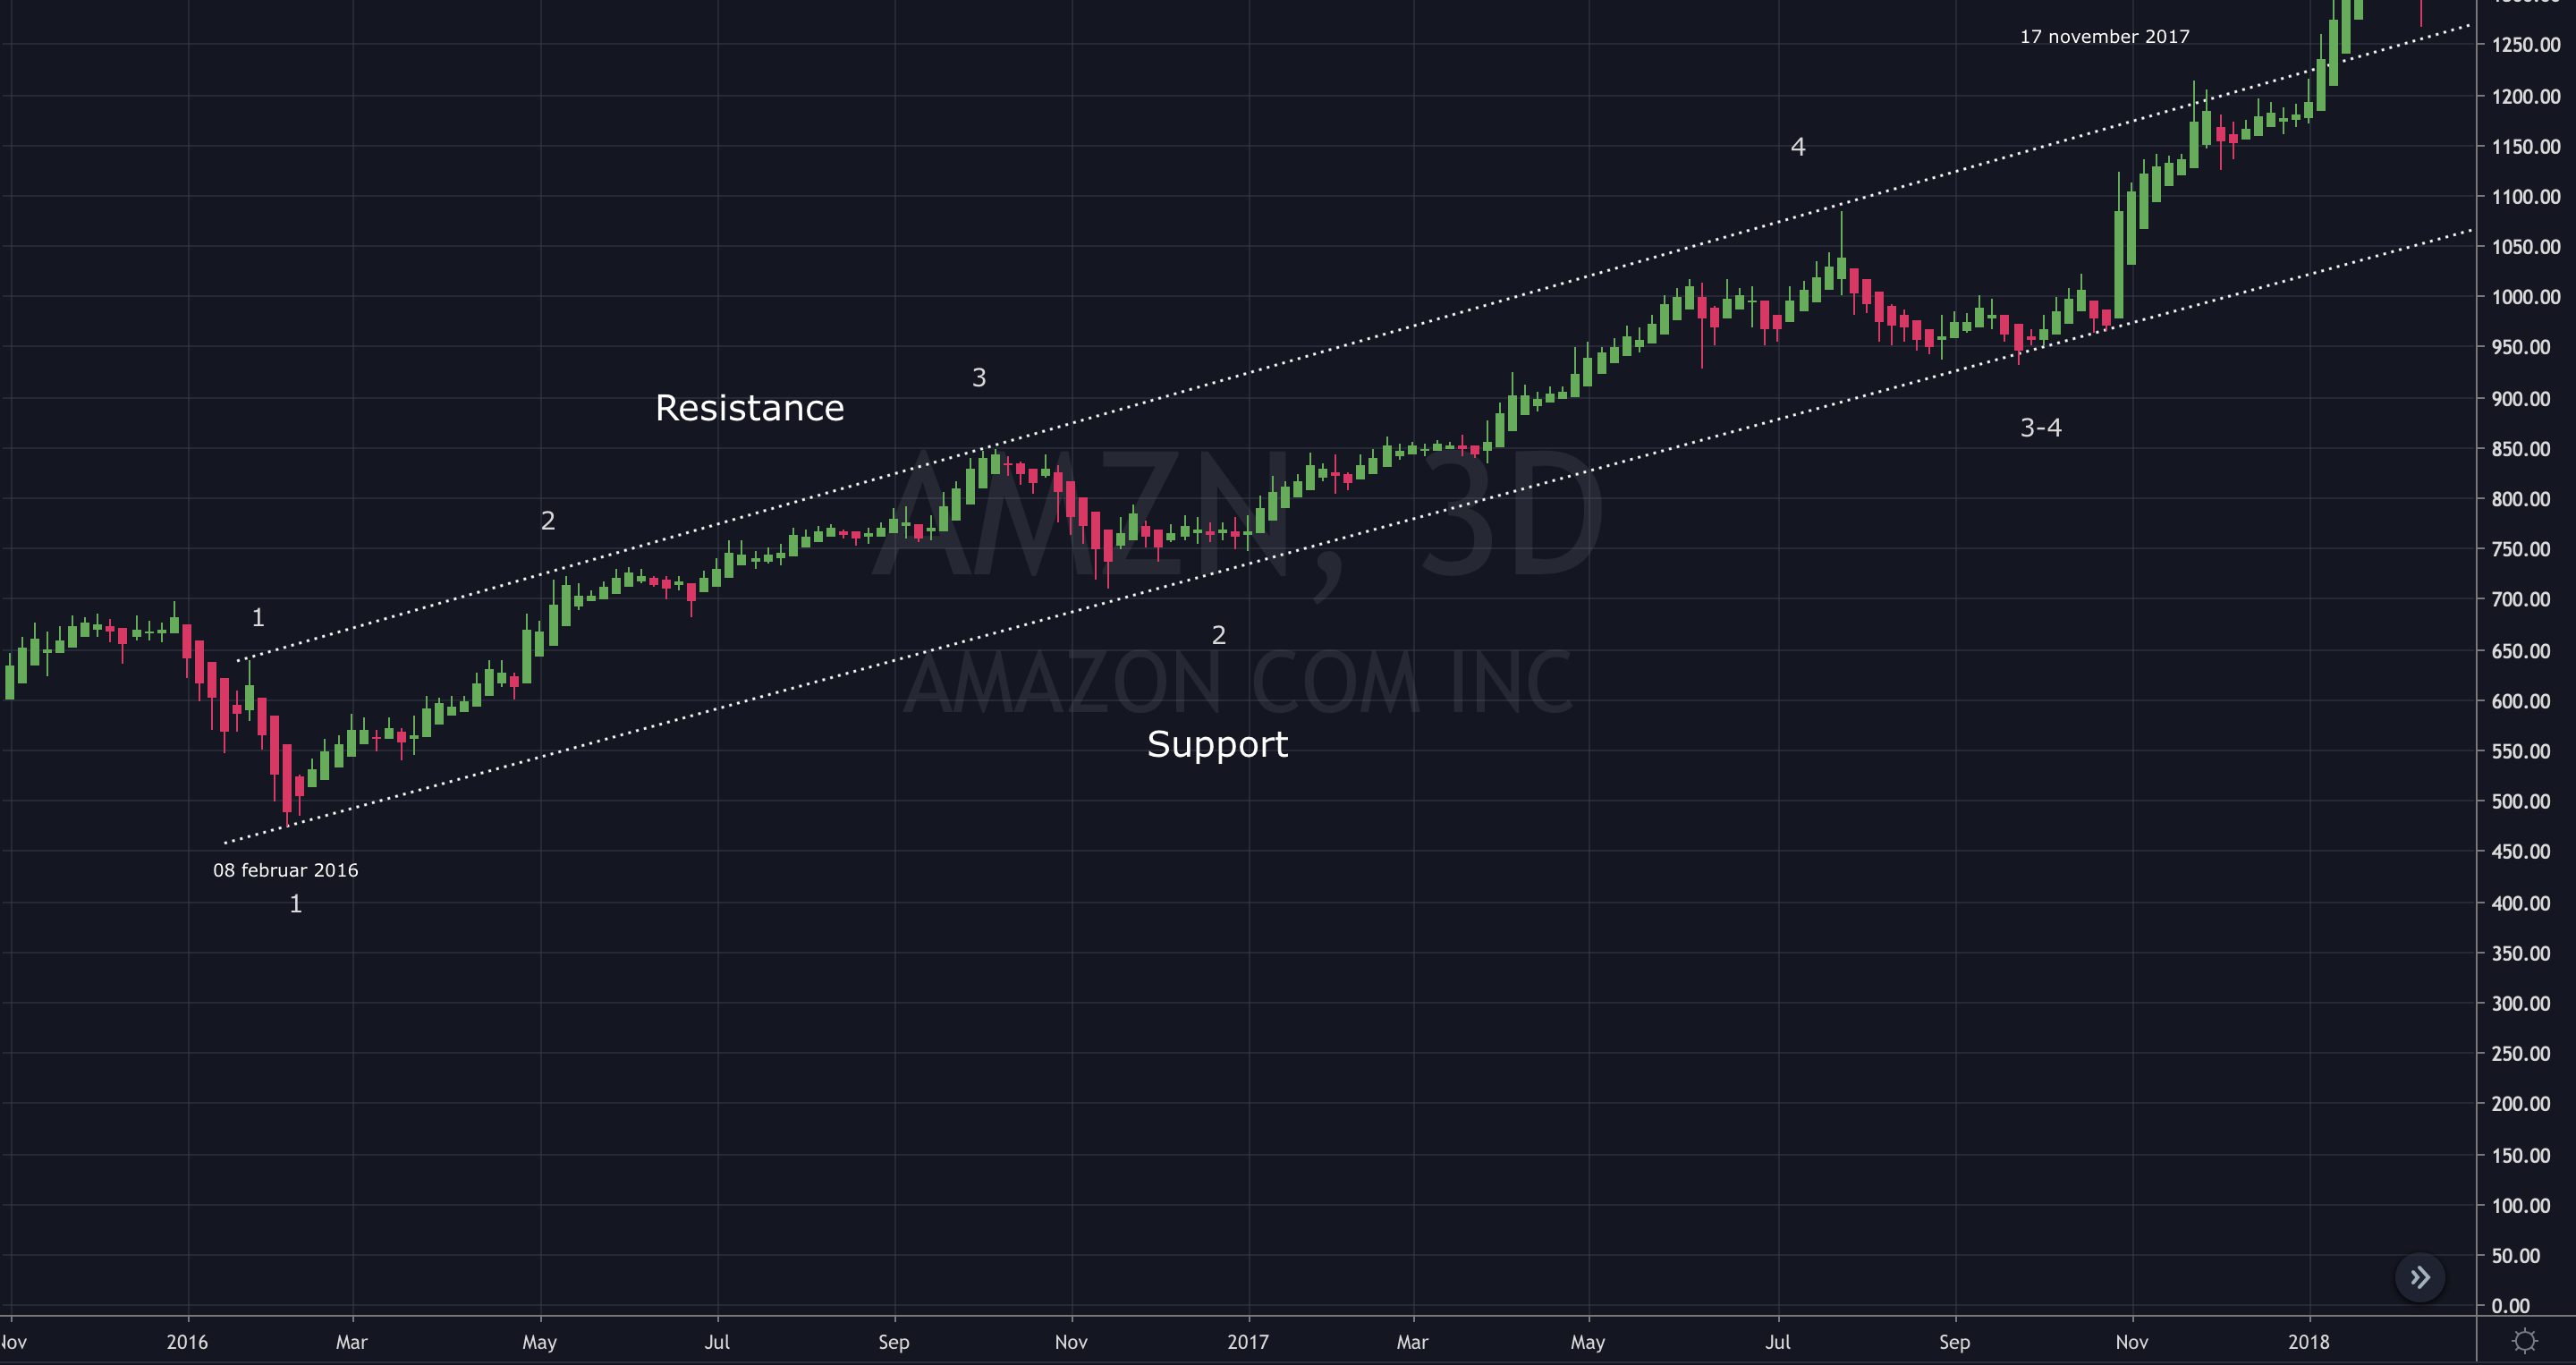
Something fascinating happened at the end of the channel, AMZN went parabolic. Even though it was in a bullish channel, increasing in value over time, it still managed to increase substantially. It was up more than 110% in less than a year. Most parabolic runups end in a substantial correction, the same is true in this case. AMZN fell 40%. The fascinating thing here is the fact that AMZN actually dropped down to the previous support level, before bouncing.

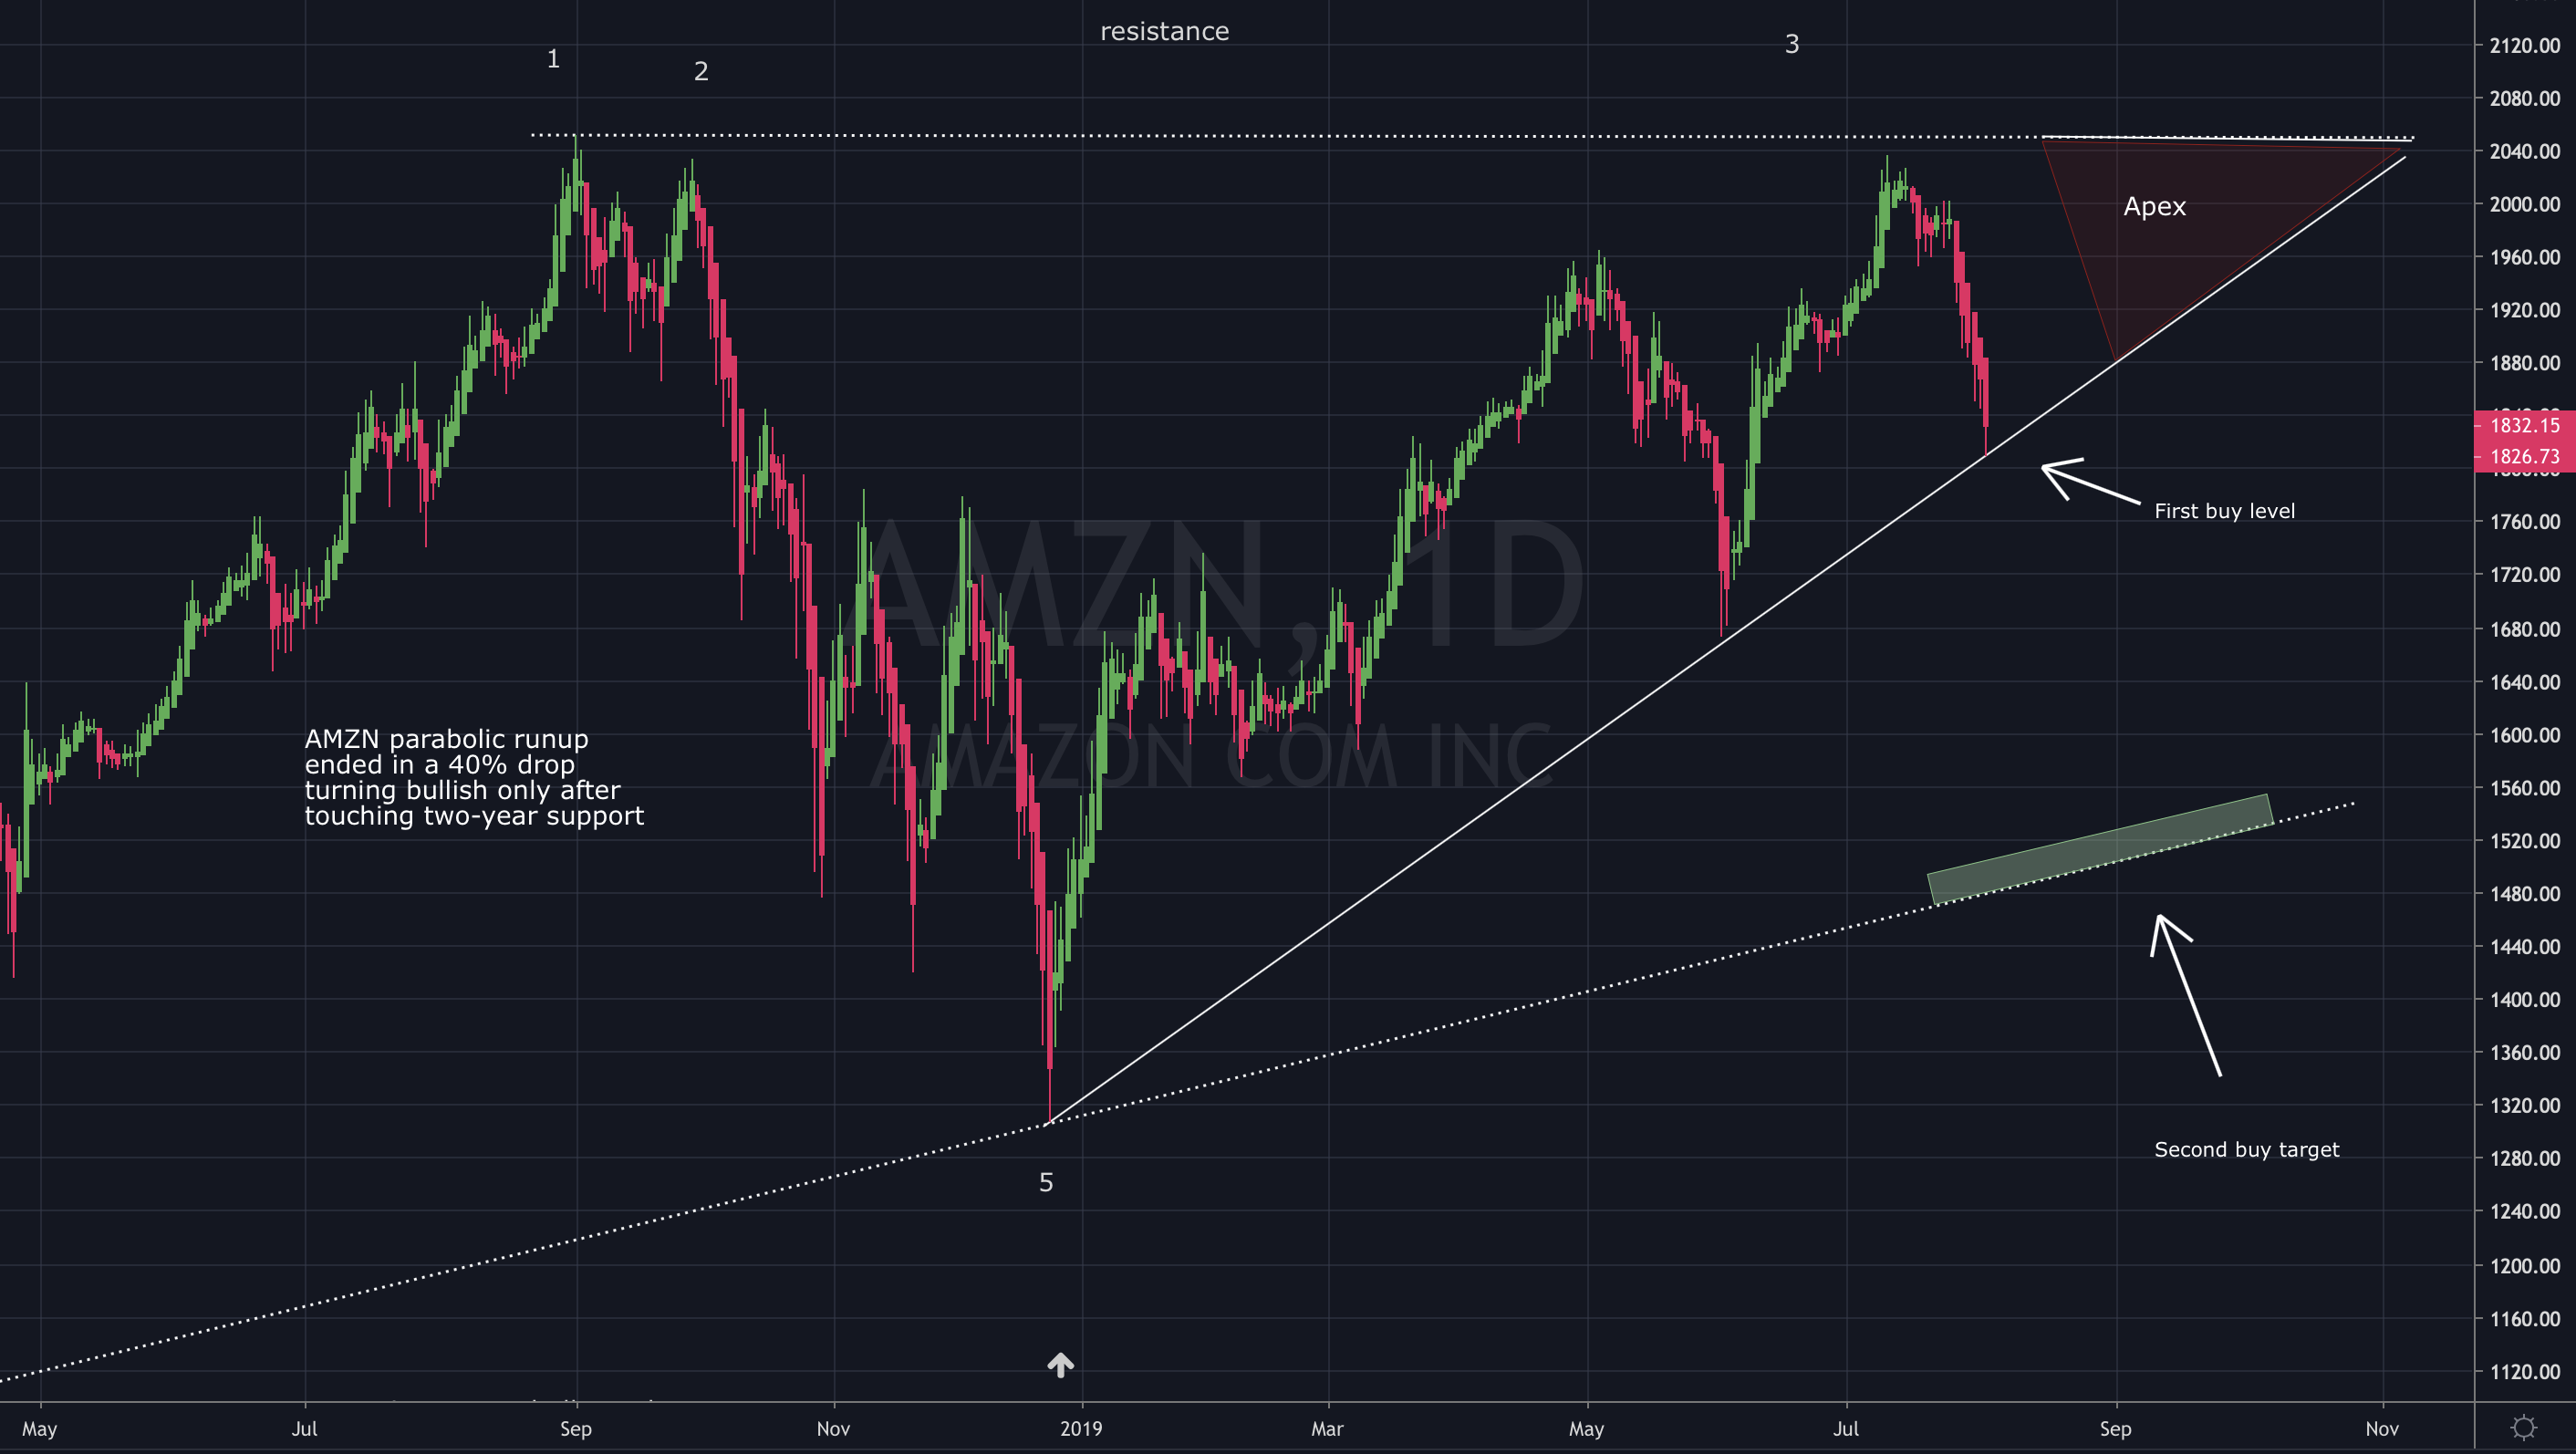
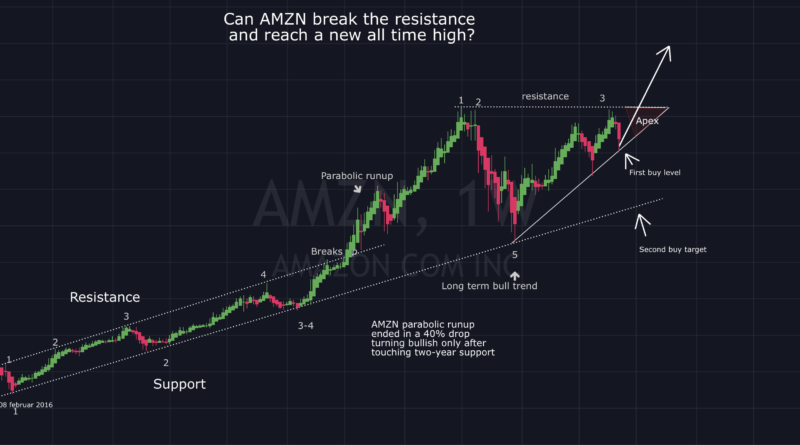
Todays trade setup
All of this brings me to the final part of this analysis, today’s price. AMZN hit resistance before breaking downwards, for the second time. It retraced around 10% before hitting our first buy target. Chances are it will bounce here. Now there is a chance the support won’t hold; in that case, the next buy target would be our long term support (marked with a green rectangle.) Even though AMZN is one highly valued company, I do believe it will rise even more as the e-commerce space becomes increasingly popular.