How to use the RSI
An essential area of investing, as well as trading, is the use of indicators. Now I don´t mean indicators like the unemployment rate, though these indicators are just as important. I am talking about technical indicators. A technical indicator is simply a mathematical equation calculated using previous price action. So today I figured we would go over one of the most popular technical indicator, the RSI. And how to trade based on the famous Relative Strenght Index.
RSI – Relative Strenght Index
Sponsored
The RSI is a momentum indicator; its primary goal is to show overbought and oversold conditions. The RSI is displayed as an oscillator. As a rule of thumb, the RSI reflects overbought conditions when values are over 70, and oversold when values are under 30. The main idea: buy when oversold, sell when overbought.
How to trade based on RSI
I mostly use the RSI to check the strength of the asset. In some cases, I also try to identify the bottom (or sometimes the top) by using the RSI. Most always, together with some other techniques. One can also draw trend lines on the RSI oscillator itself, just like we do at the when charting the price.
When using the RSI we normally buy an asset when the RSI is oversold, and sell when RSI is showing overbought. However, this is not always the case. As a fundamental bad stock will rarely have a profound bounce, even if the RSI is in the low twenties. Once again, a stock´s price is determined by the fundamentals. That is why we preach fundamental analysis first.
Advertisement
When using the RSI we normally buy an asset when the RSI is oversold, and sell when RSI is showing overbought. However, this is not always the case. As a fundamental bad stock will rarely have a profound bounce, even if the RSI is in the low twenties. Once again, a stock´s price is determined by the fundamentals. That is why we preach fundamental analysis first.
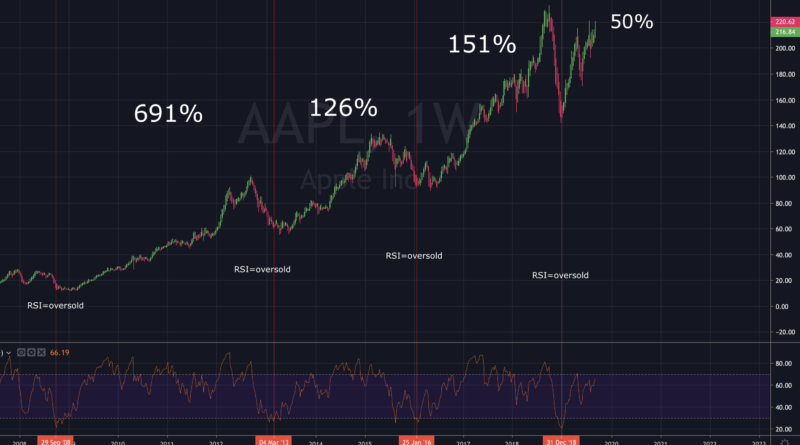
Depicted below we have a clear example of this. The company in question is GameStop, an incredibly fragile company with really bad fundamentals. On the chart itself, I have marked each time GME showed oversold (under 30) at the RSI, as well as on the price itself. Every time the RSI gave us an oversold signal (buy signal), it bounced on average 30%. BUT, if we didn´t sell at the top (which is hard) and held on to the stock, we would lose money over time. Once again, the fundamentals outweigh the technical.
When do we use the RSI then?
Well, if we identify a fundamentally strong stock, we can use the RSI to find a more suitable entry price, as well as an exit price. Technical analysis is and always will be a secondary analysis for us here at CVI. Especially when combined with investing. Let me elaborate, a fundamental sound company is much more likely to increase in value over time than companies like GME for instance.
Ads by Google
You might consider the 30% ROI GME gave a nice catch. But fundamental strong companies can give a much higher ROI, while also minimizing risk. Simply put, more eyes are watching the stock, and more people are willing to increase their stake should the company lose some value. People consider such companies to be, well, on sale after a 30% drop in price. Hence, the price increase afterward.
Example on how to use the RSI
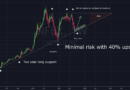
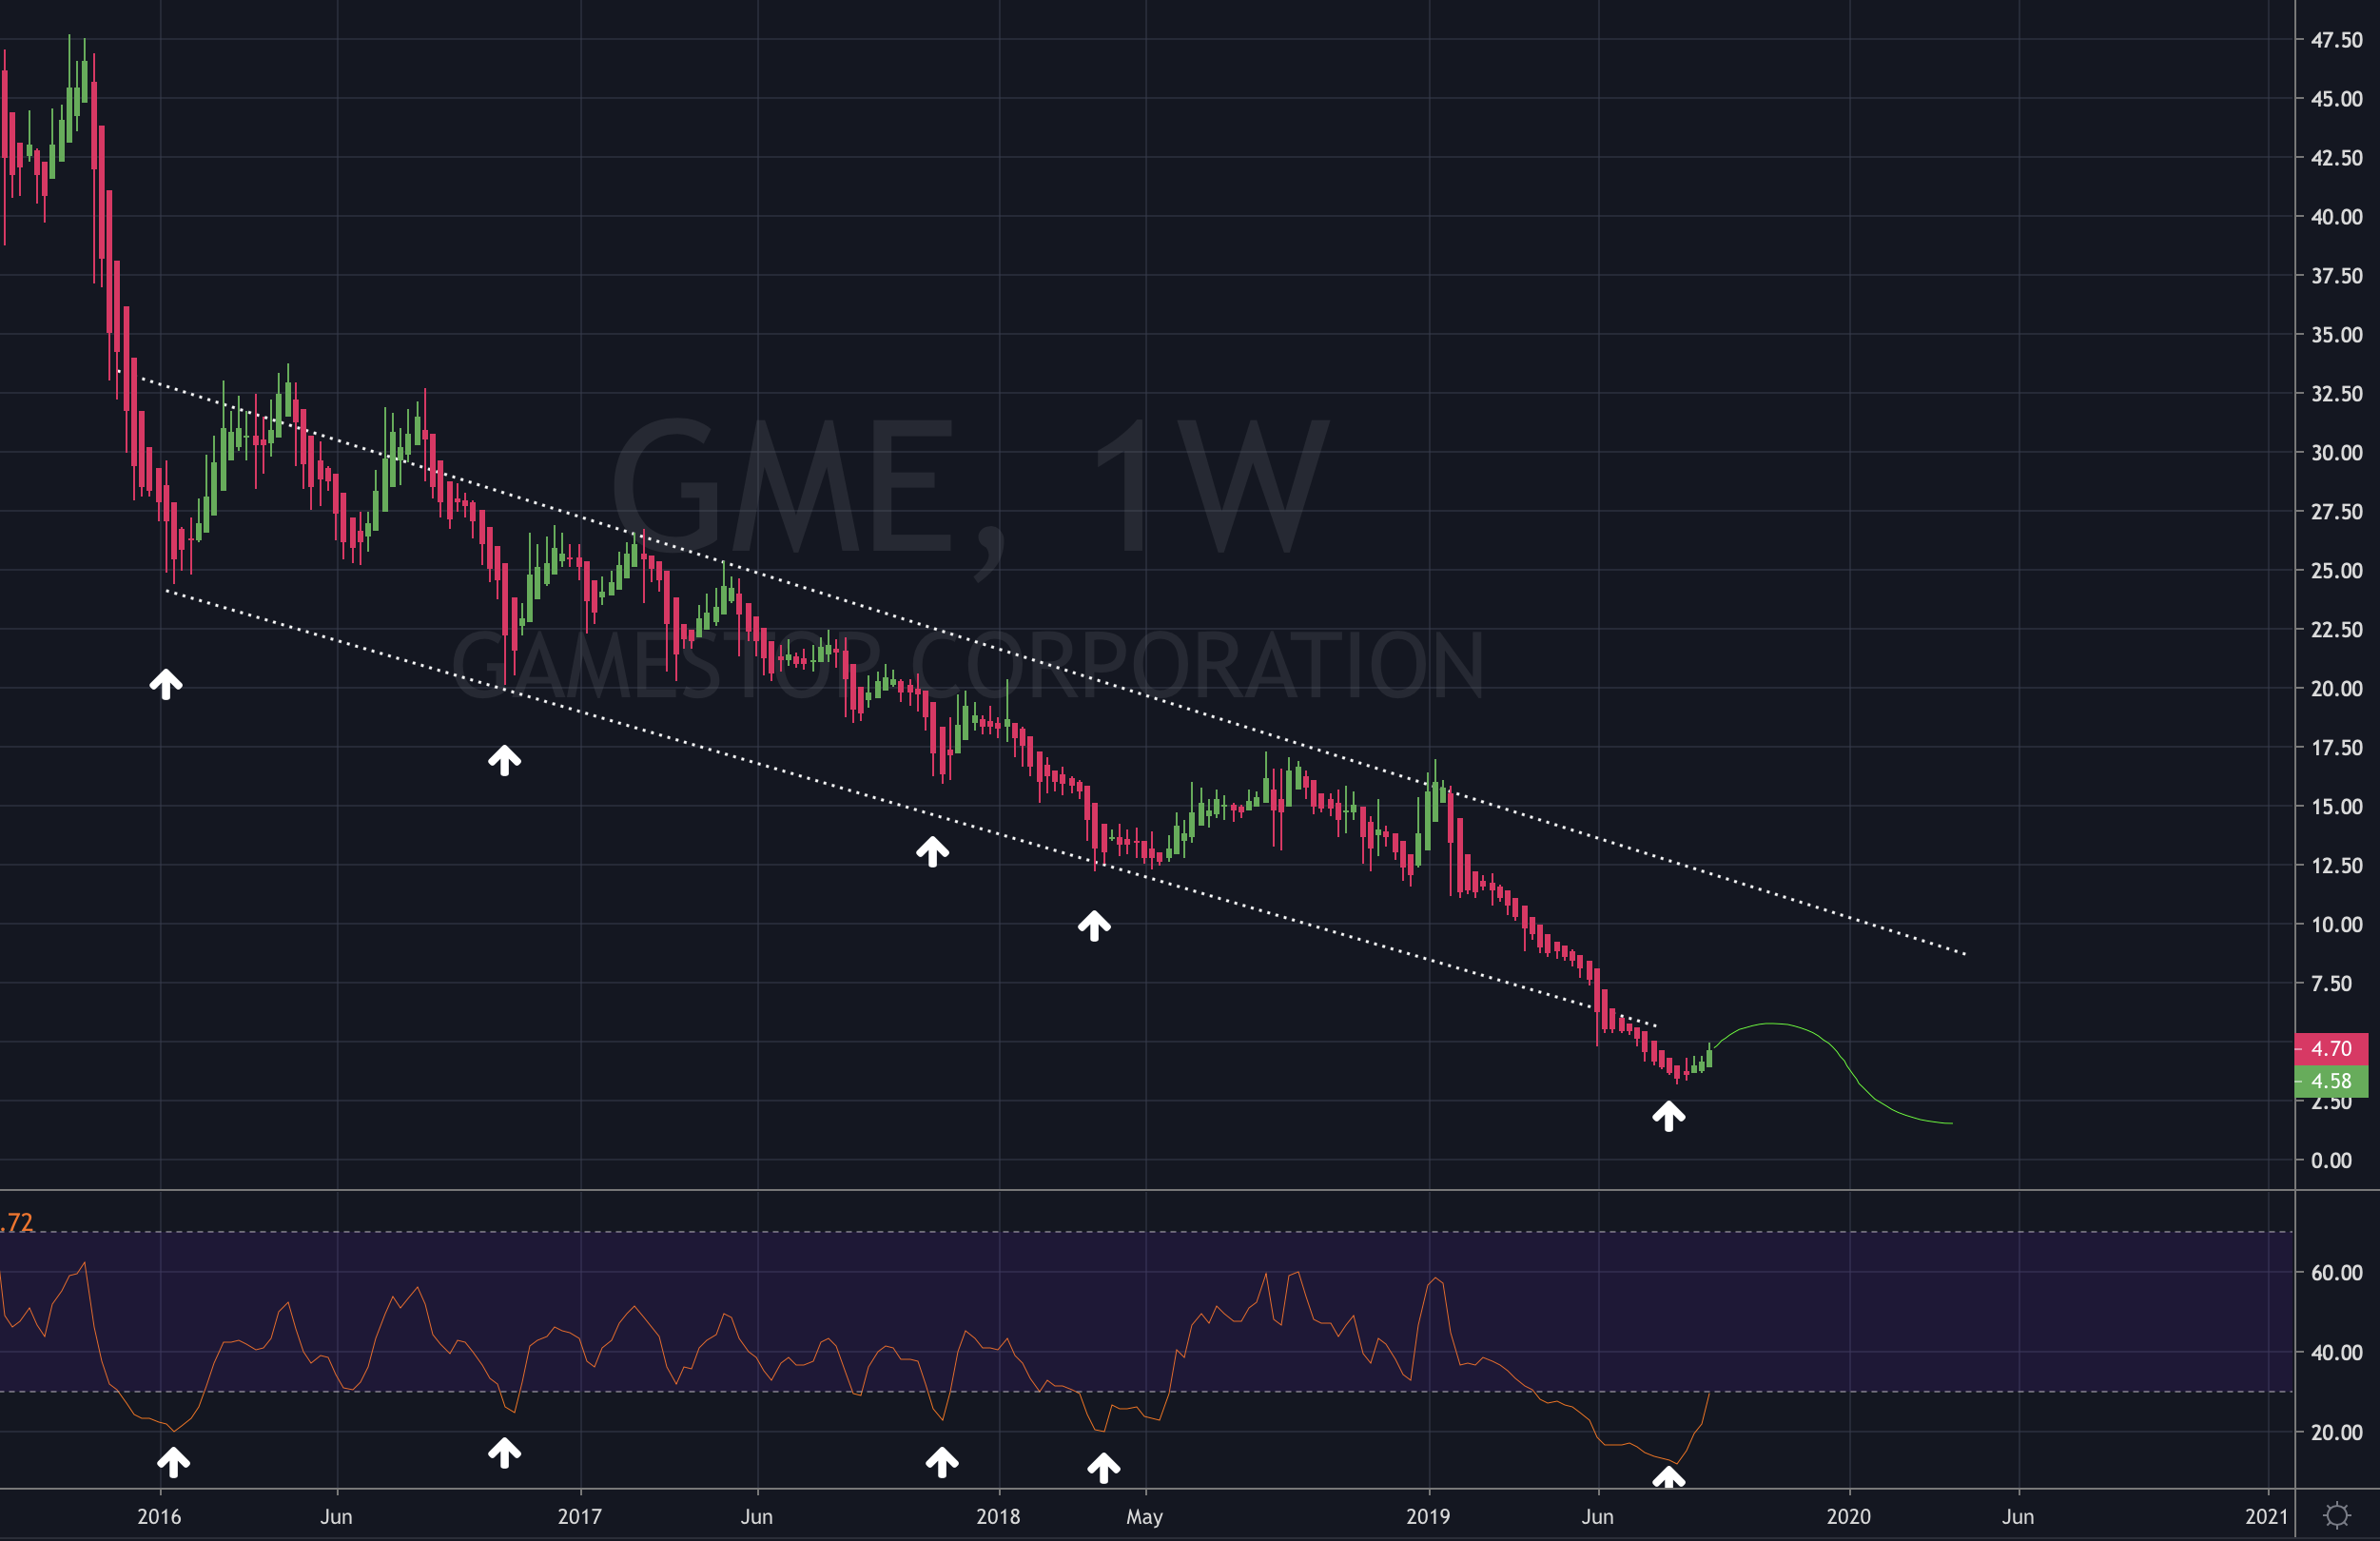
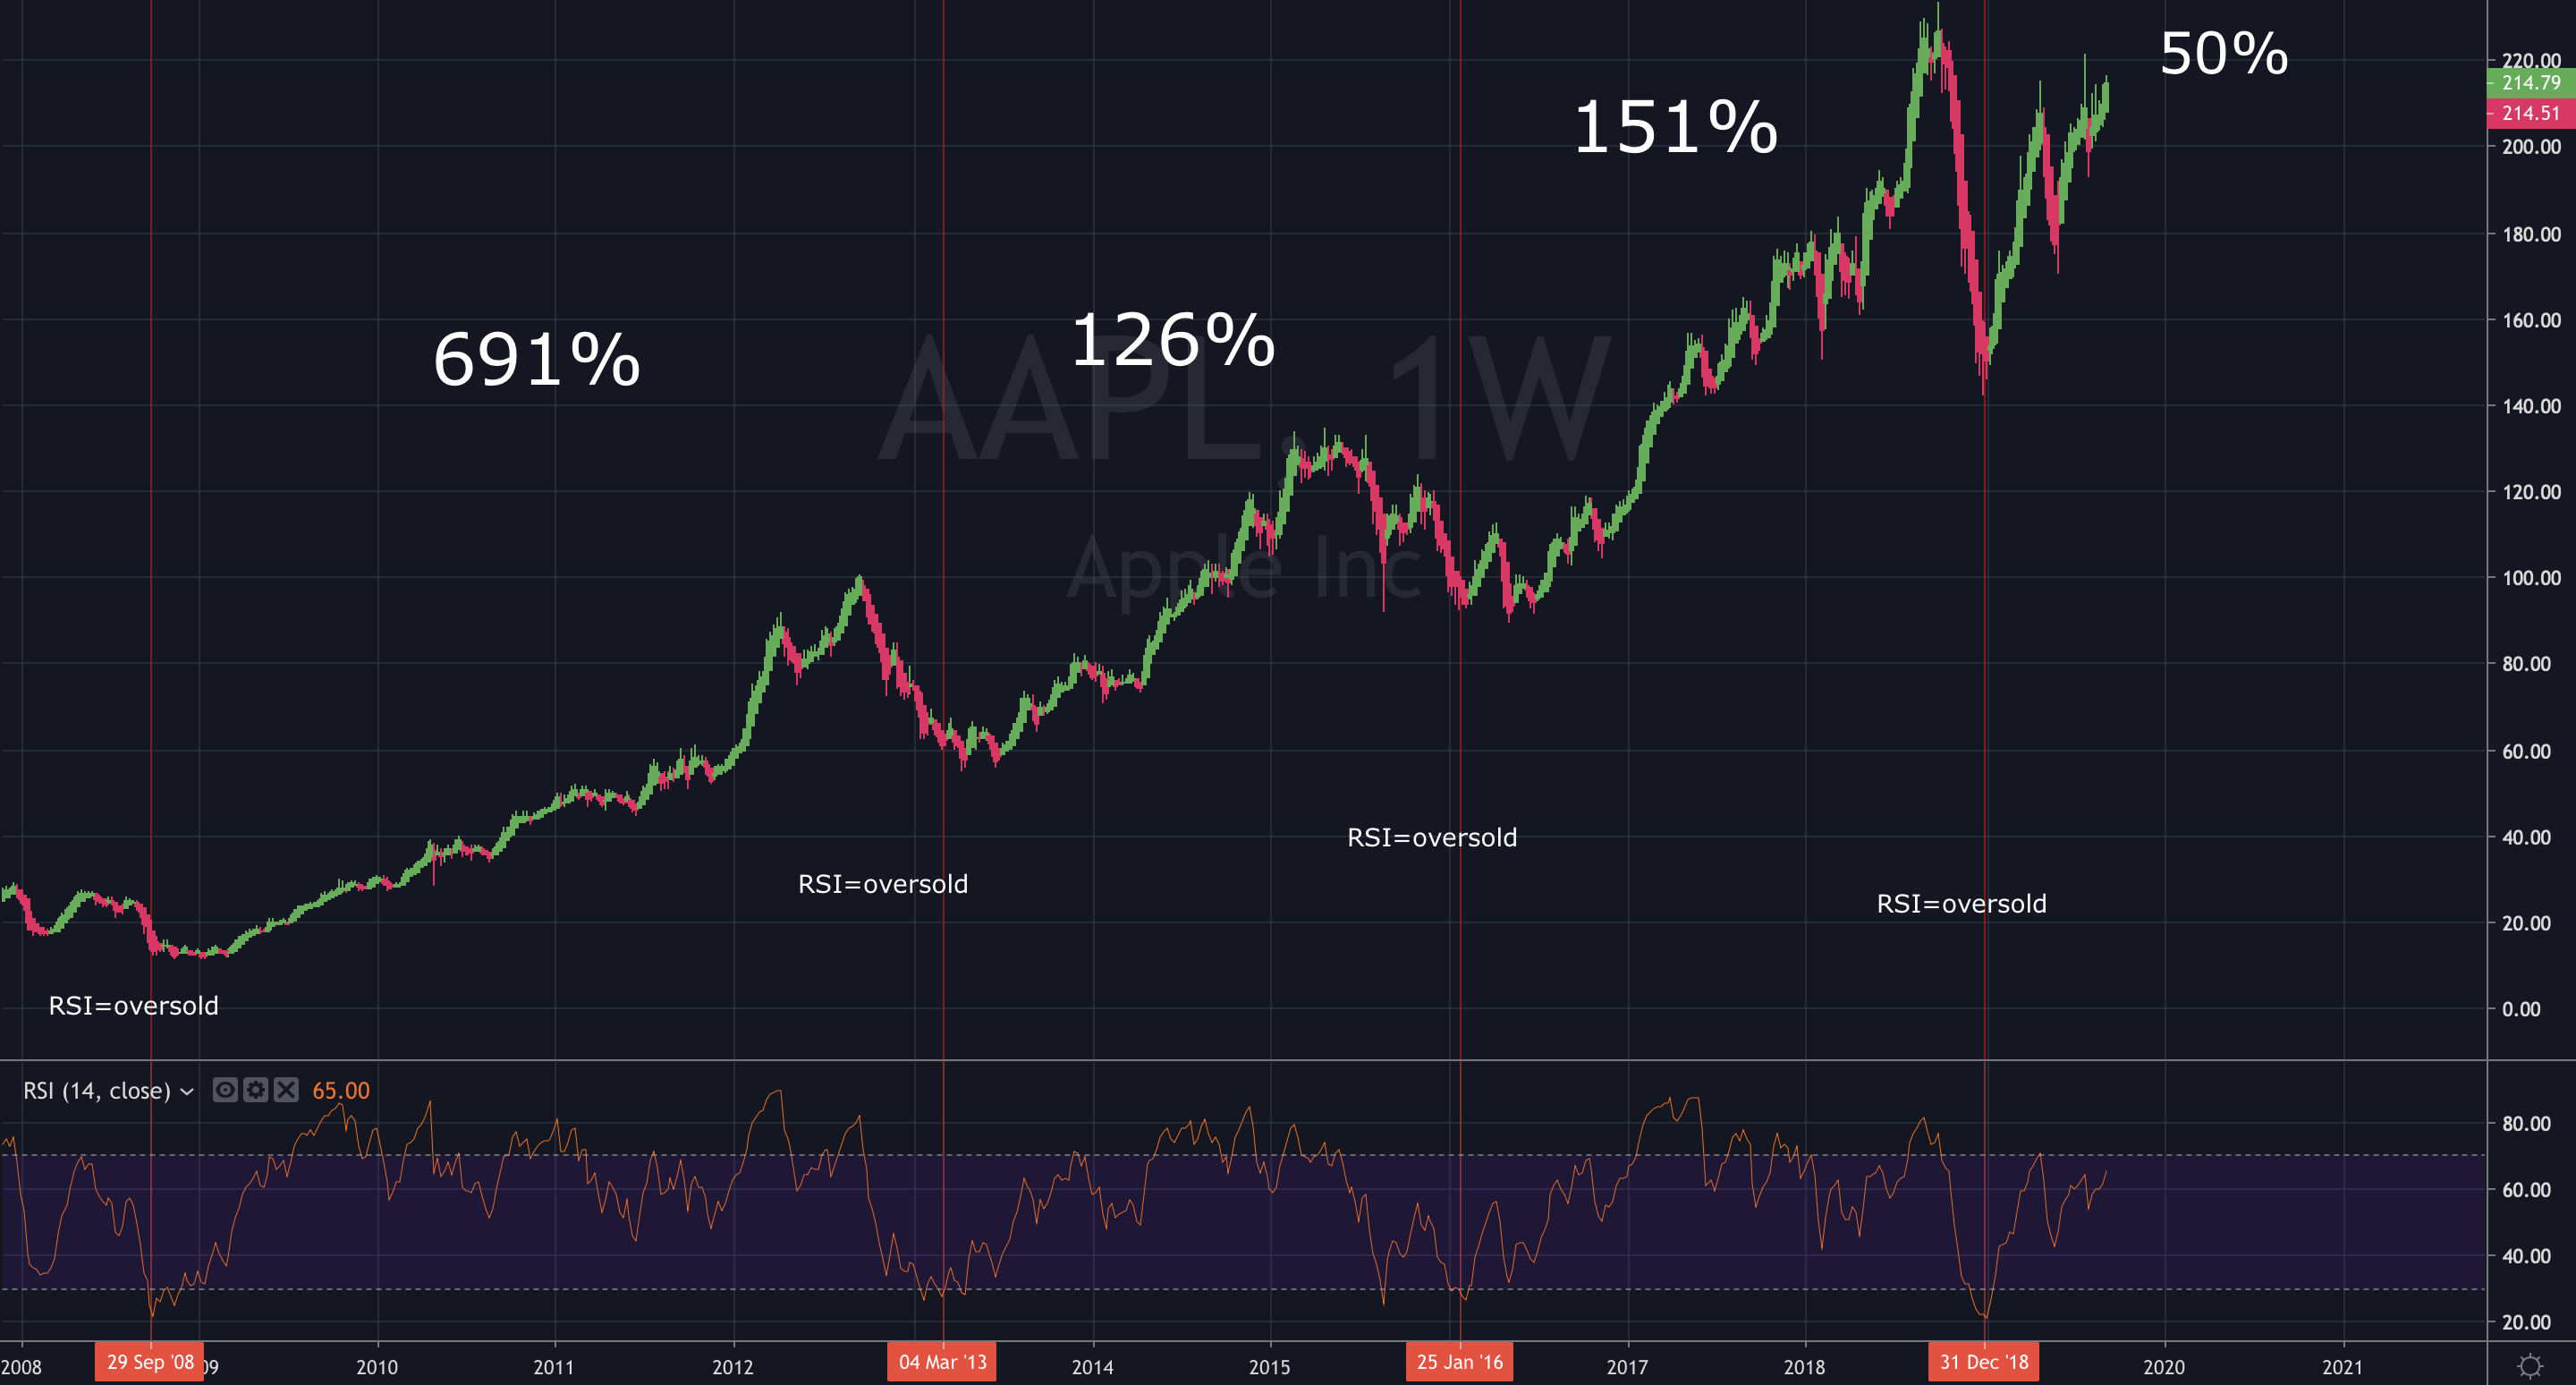
Under is an example of such a company seeing its price grow after a harsh drop. The company in question is Apple, a fundamental sound company (in my opinion). We will use the same time frame we used in GME to put things in perspective. Once again, every time the RSI showed oversold, is marked on the chart. This time, using a red line. As you can see, since Apple is fundamentally strong, it increases in value over time. Making it a much safer bet the GME. In this example, we can use the RSI to trade with our invested stake in Apple. As you see, the first time the RSI showed oversold, to the far left, the stock ended up with a maximum of 691% increase. The second time, 126%, then 151%, and the last time it was oversold, it increased by 50% (time of writing). This shows the power of technical analysis when combined with value investing.
Summary
The RSI is displayed as an oscillator, where values under 30 give us buy signals, and values over 70 give sell signals (not always used, except when trading). The RSI should always be used in conjunction with value investing, as well as other forms of technical analysis. For the highs ROI and minimized risk.