Netflix hits our buy target! 40% upside, here is the trade in detail!
Exactly one month ago I published an article about three stocks to follow, describing their setups, here. Today I want to revisit one of those stocks as they have finally hit our expected target. The company in question is Netflix. I wrote in detail how I would trade it, a technique called laddering. I bought a position at 316$, enabling me to have some shares should the stock rally.
30 days ago
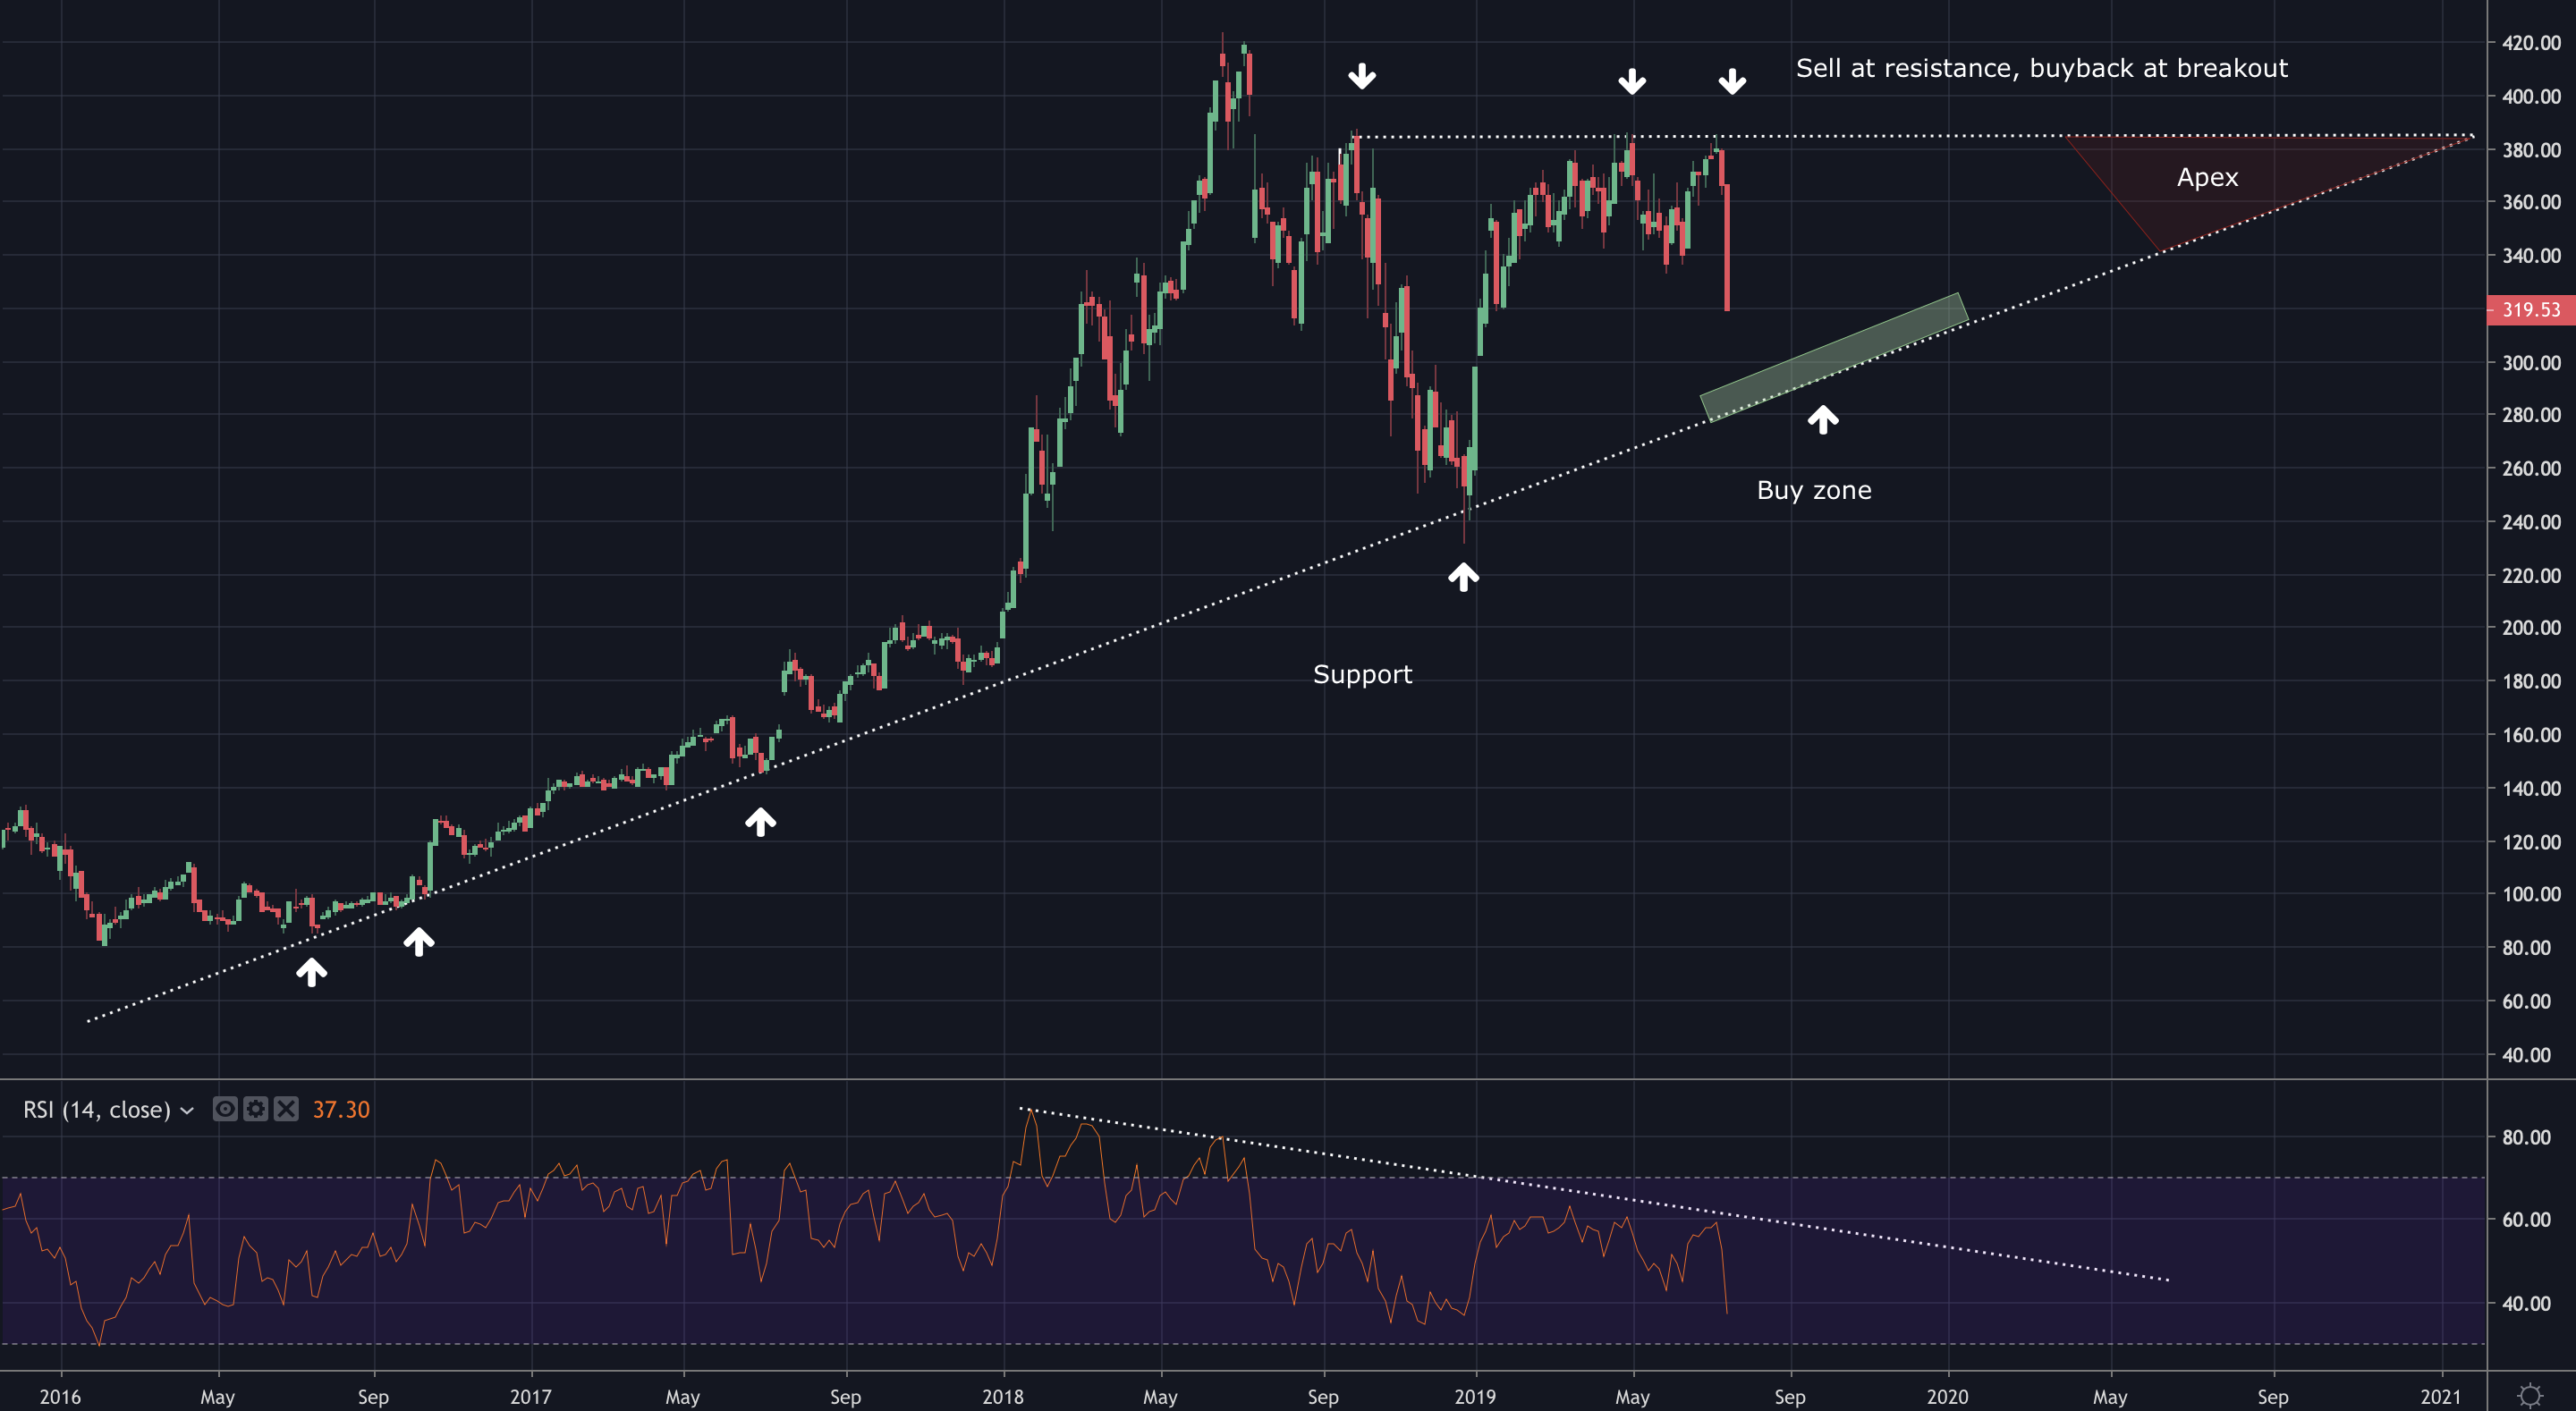
The first chart I’ll show is from 30 days ago. As you can see, we have four touches on our two-year-long support line, where our new buy zone is lined up. The main goal here would be to buy at support. Notice how the RSI (purple oscillator at the bottom) formed a resistance, reassuring us the trend is bearish.
Today
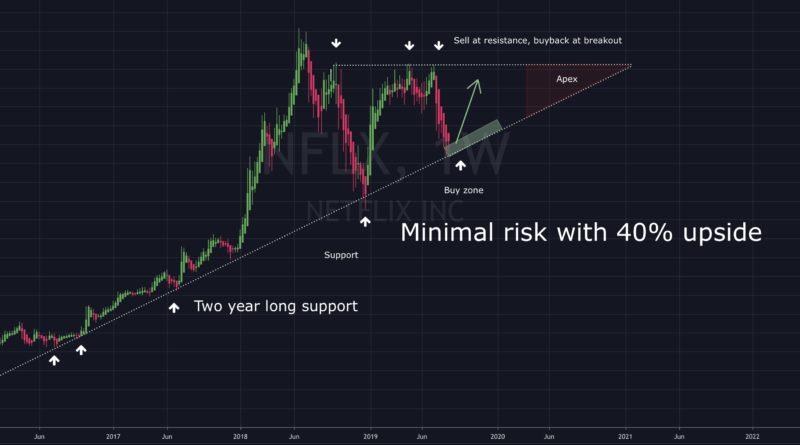
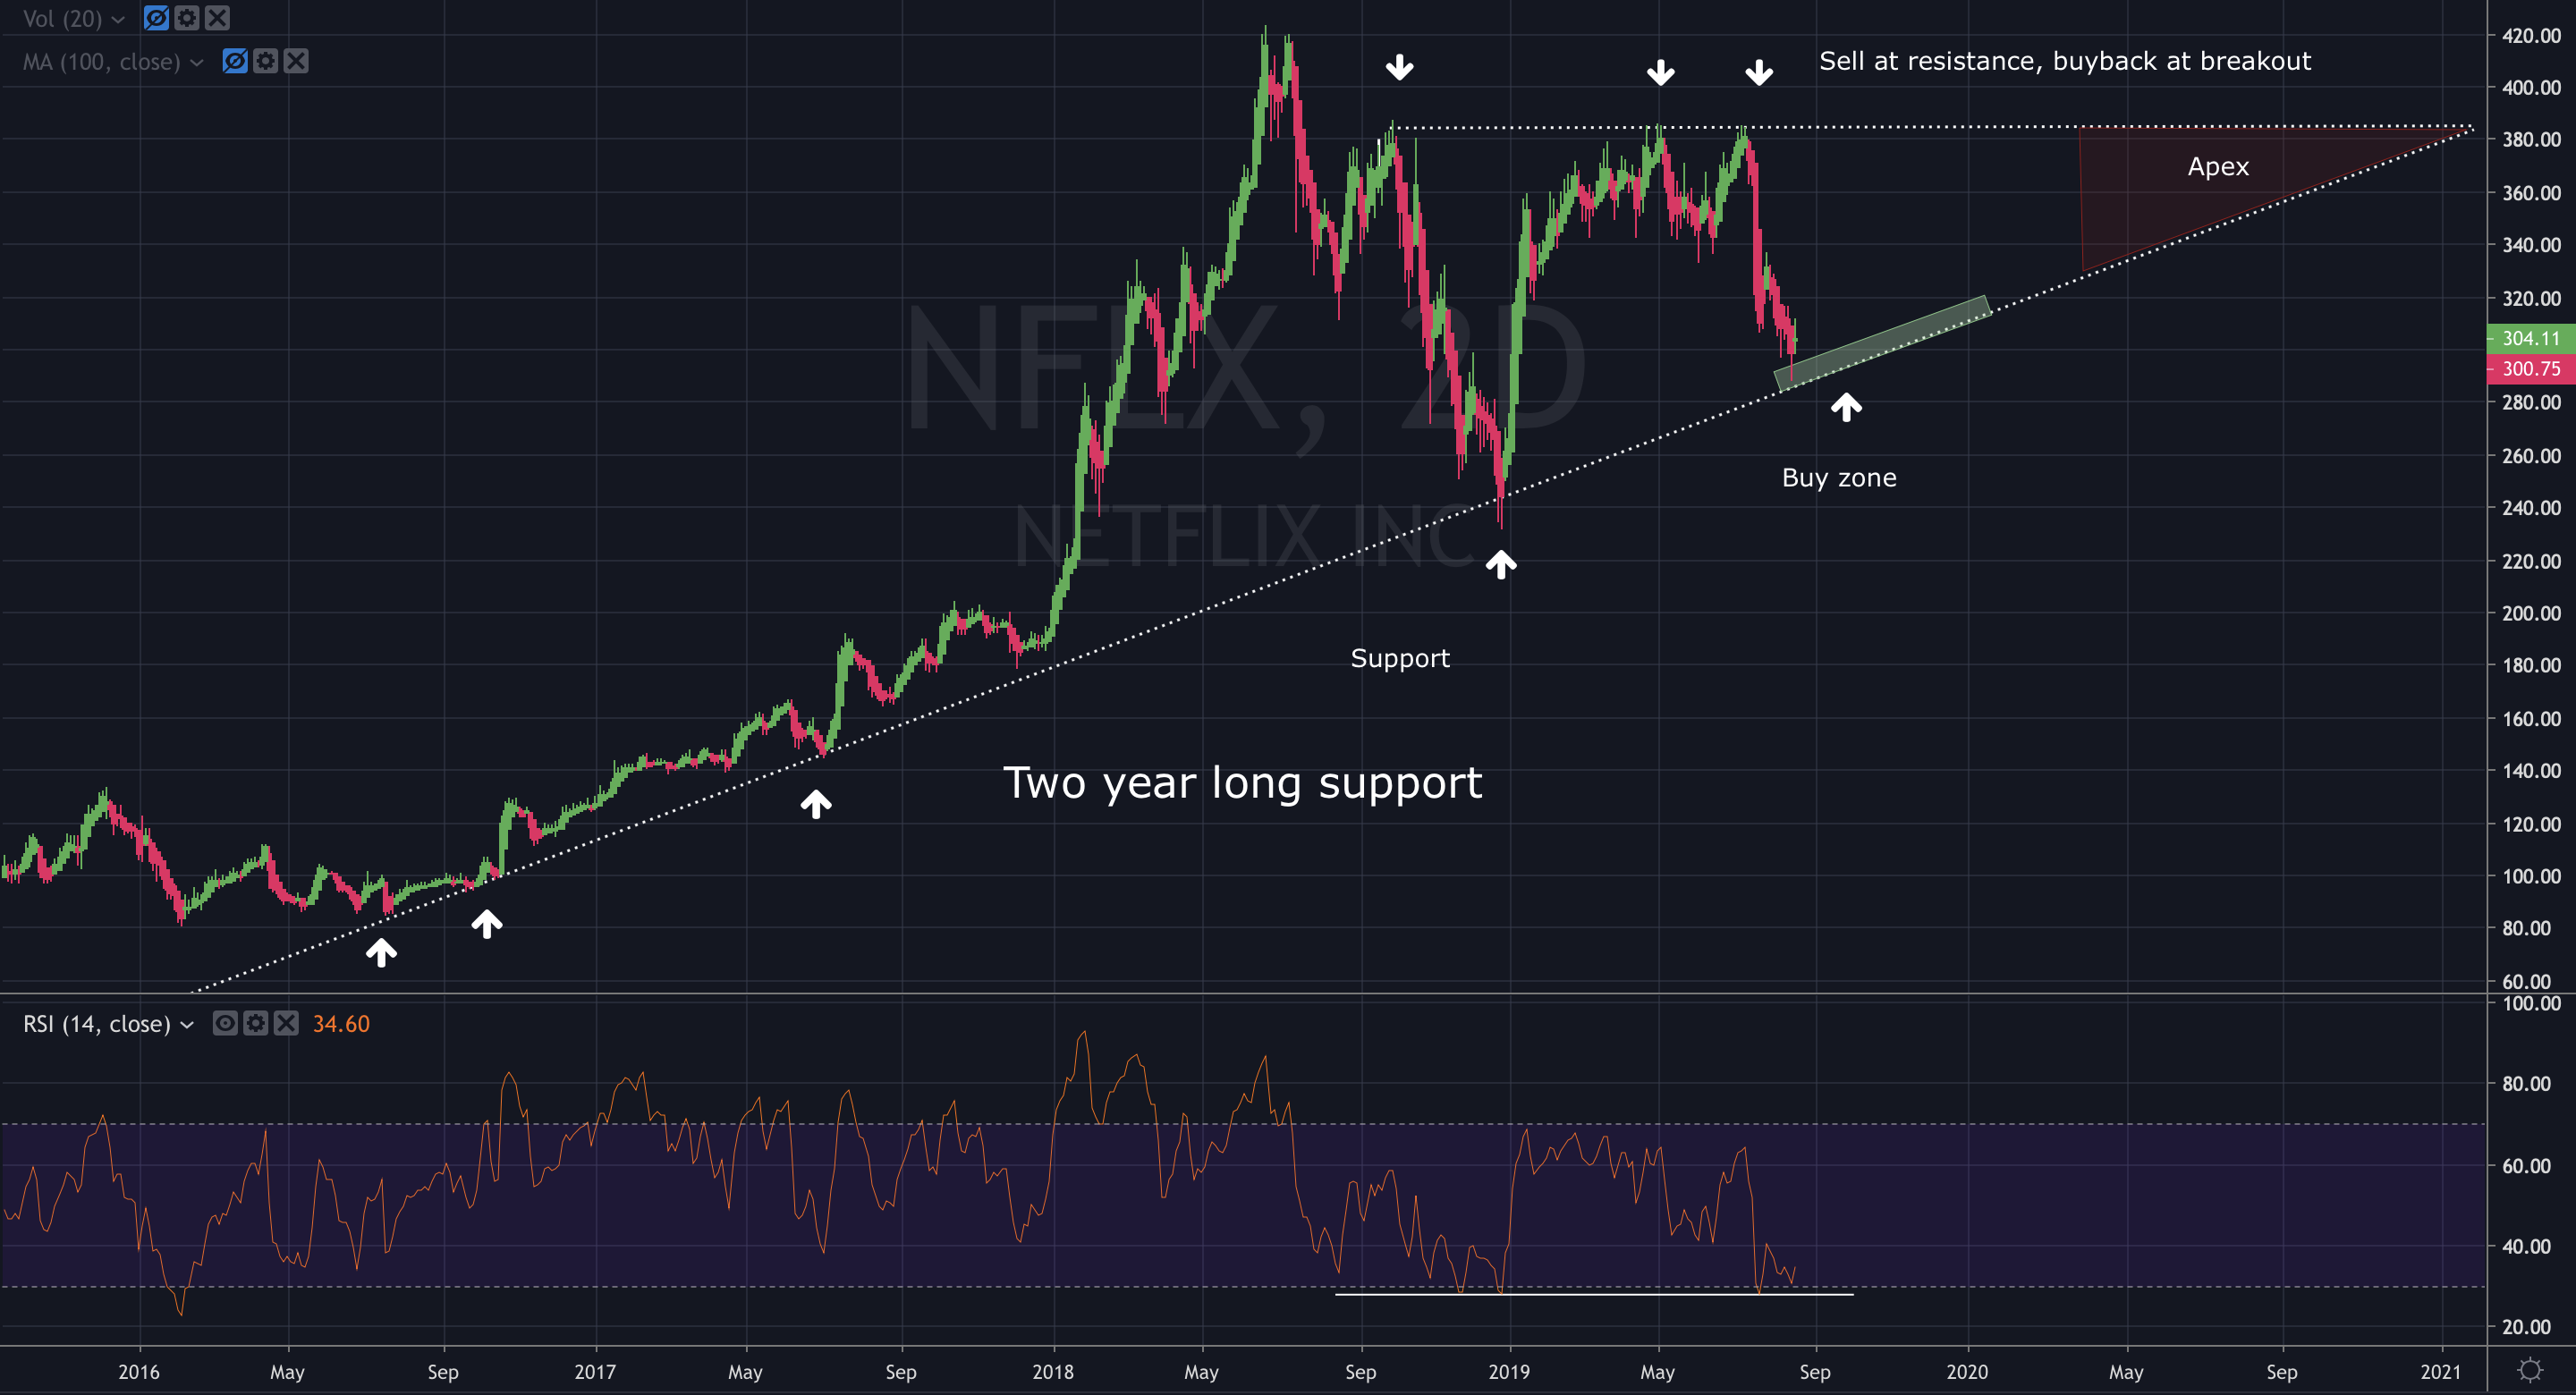
“If the price keeps dropping and hits my buy zone (marked with a green rectangle), I’ll double down. At this point, I set a stop-loss somewhere under the support.” – was our statement last month! As you can tell the price continued to drop and hit our target like planned. Our next move is to take a position here with the first target being resistance (27%).
Sponsored:
The second target is the previous ATH (39%), and the third would be 500$ (65%). The two-year-long support line can always be broke, even though unlikely. Therefore we always place a stop-loss order carefully under the support to minimize losses. I also want you to pay attention to the purple part below the chart. This is called the RSI, a widely used indicator among traders. As you can see, the RSI also hit support together with price, giving us more reassurance this is, in fact, the local bottom.
 As always, if there are any questions, please leave a comment, and I will be responding to every single one of you.